Figure 4.

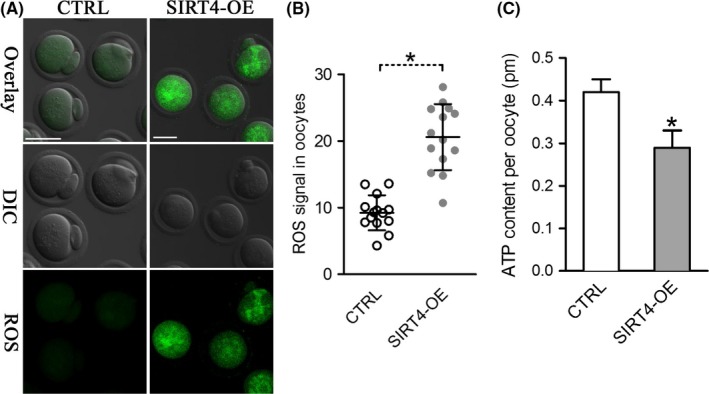
SIRT4 overexpression causes metabolic dysfunction in oocytes. (A) Representative images of CM‐H2DCFAD fluorescence in control and SIRT4‐OE oocytes. Scale bar: 50 μm. (B) Quantitative analysis of fluorescence intensity shown in panel A (n = 14 for each group). (C) Histogram showing the ATP level in control and SIRT4‐OE oocytes (n = 20 for each of the three trials). Data are expressed as the mean ± SD, student t test was performed on the three means of the experiments. *p < 0.05 vs. controls
