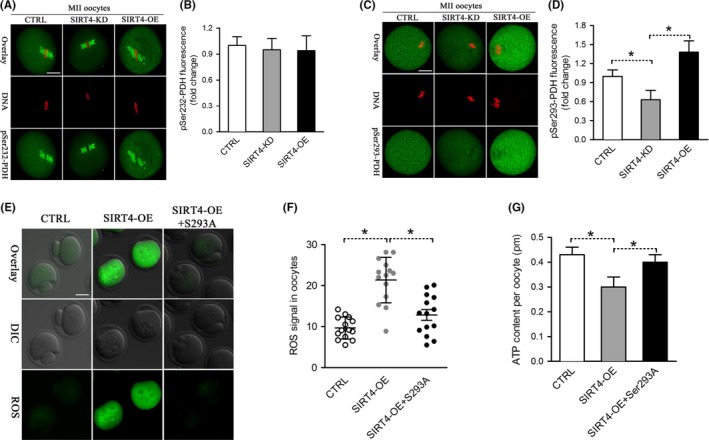
Figure 6.

Phosphorylation of Ser293‐PDHE1α mediates the effects of SIRT4 on oocyte metabolism. (A) Control, SIRT4‐KD, and SIRT4‐OE oocytes were stained with pSer232‐PDHE1α antibody (green) and costained with PI (red) for DNA. (B) Quantification of pSer232‐PDHE1α fluorescence in (A). (C) Control, SIRT4‐KD, and SIRT4‐OE oocytes were labeled with pSer293‐PDHE1α antibody (green) and costained with PI (red) for DNA. (D) Quantification of pSer293‐PDHE1α fluorescence in (C). (E) Representative images of CM‐H2DCFDA fluorescence (green) in control, SIRT4‐OE, and SIRT4‐OE+Ser293A mutant oocytes. (F) Quantification of the relative level of ROS in oocytes. Each data point represents an oocyte (n = 14 for each group). (G) Histogram showing the ATP level in control, SIRT4‐OE, and SIRT4‐OE+Ser293A mutant oocytes (n = 20 for each of the three trials). Data are expressed as the mean ± SD, student t test was performed on the three means of the experiments. *p < 0.05 vs. controls. Scale bars: 25 μm
