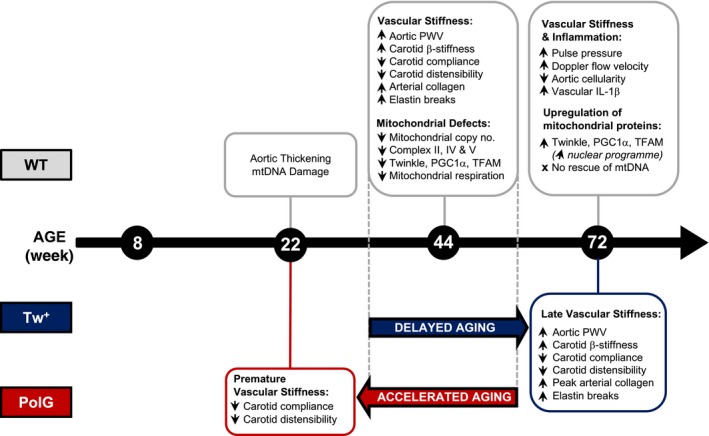
Figure 7.

Changes in WT, Tw+ and PolG mice during vascular aging. Summary of the age at which changes are first observed over 8–72 wk of age in WT, Tw+ and PolG mice. mtDNA, mitochondrial DNA; mtCN, mitochondrial copy number; PWV, pulse wave velocity
