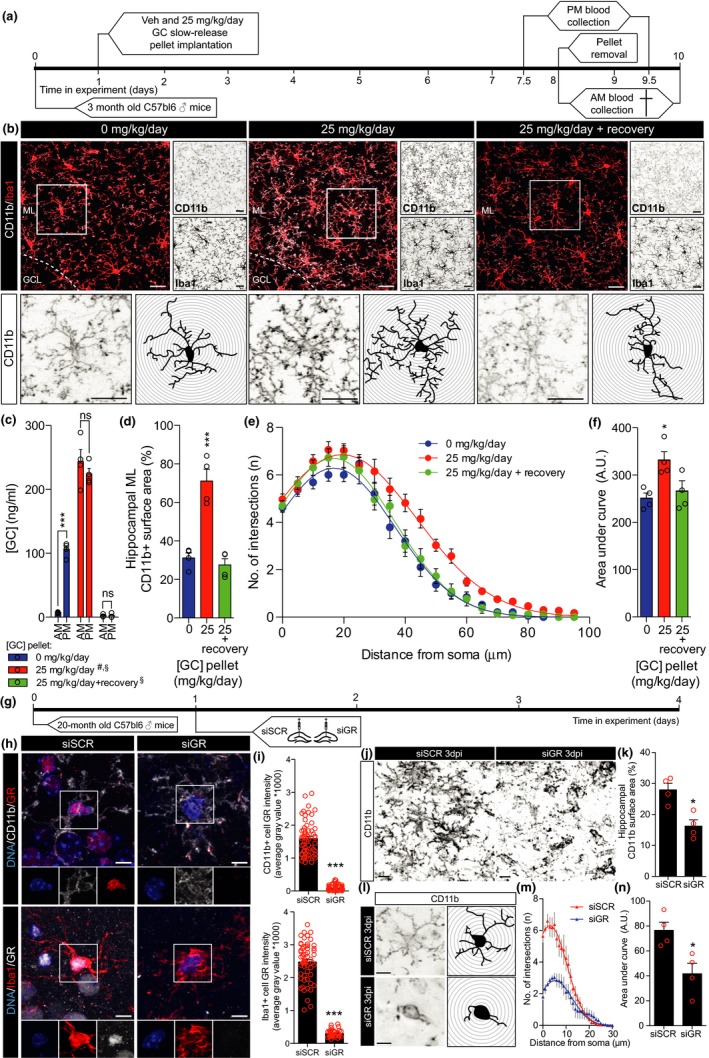
Figure 2.

GC‐mediated modulation of hippocampal CD11b+ cell morphology in 3‐month‐old mice and GR‐mediated modulation of hippocampal CD11b+ cell morphology in 20‐month‐old mice. (a) Experimental setup used for panels b–f. (b) Micrographs displaying hippocampal CD11b (white) and Iba1 (red) staining after GC treatment on low magnification (top left) and separate immunoreactivity of CD11b and Iba1 (top right). CD11b staining in boxed area of the top left panel is magnified (bottom left panels) to show individual cells and their respective tracings (bottom right panels). (c) AM and PM blood plasma GC levels bar graph and significant differences are indicated as follows: ***p < 0.001, AM vs. PM in vehicle, ns p > 0.05, AM vs. PM in GC and GC + recovery; #p < 0.001, CORT AM and PM vs. vehicle AM and PM; §p < 0.001, both AM and PM in vehicle and GC vs. GC + recovery. (d) Hippocampal CD11b surface area bar graph. (e) Sholl plots displaying CD11b+ cell intersections per 5 μm steps from the cell soma. (f) Sholl analysis‐derived area under curve (arbitrary units: A.U.). (d–f) Significant differences are indicated as follows: *p < 0.05, ***p < 0.001, vs. vehicle, one‐way ANOVA. (g) Experimental setup used for panels h‐n. (h) Micrographs displaying GR intensity in CD11b+ (top panels) and Iba1+ (bottom panels) cells of siSCR (left)‐ and siGR (right)‐injected hippocampi. Boxed areas are shown as separate channels below. (i) CD11b+ (top) and Iba1+ (bottom) cell nuclear GR intensity quantifications for siSCR and siGR treatments. (j) Micrographs displaying CD11b staining of siSCR (left)‐ and siGR (right)‐treated hippocampi. (k) Hippocampal CD11b surface area quantification. (l) Micrographs displaying individual CD11b+ cell morphology (left) and traces (right) of siSCR (top)‐ and siGR (bottom)‐treated hippocampi. (m) Sholl plots displaying CD11b+ cell branch complexity per 1 μm steps from the cell soma. (n) Sholl analysis‐derived area under curve quantifications of siSCR‐ and siGR‐treated mice (arbitrary units: A.U.) (i, k, and n) Significant differences are indicated as follows: *p < 0.05, ***p < 0.001, siSCR vs. siGR, Student's t test. Scale bars = 20 (b), 10 (h), and 7 μm (j and l).
