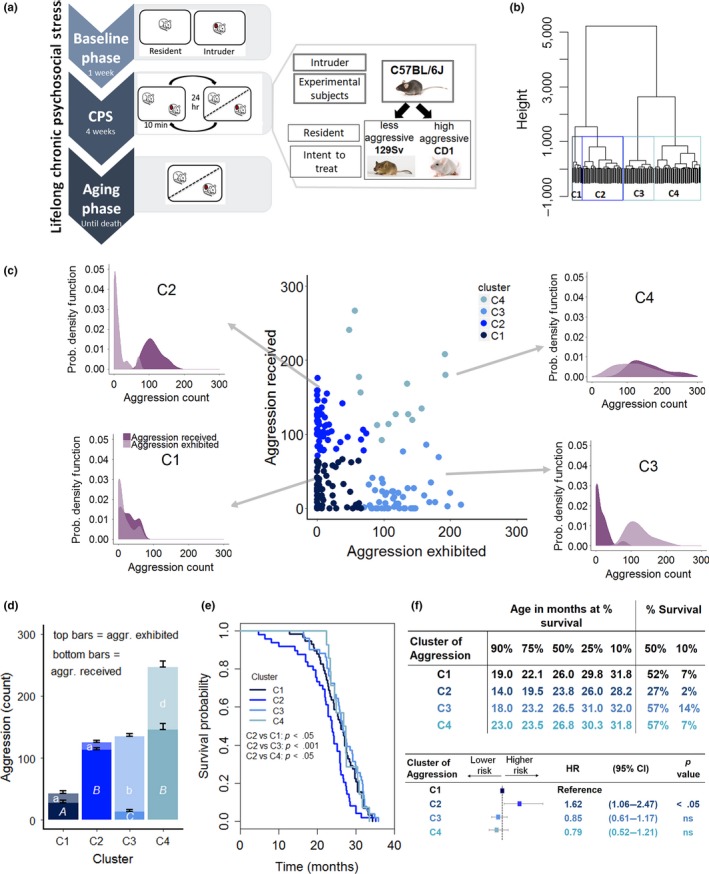
Figure 1.

Effect of contextual aggression on survival. (a) Diagram of the lifelong chronic psychosocial stress (LCPS) model. (b) Dendrogram of the experimental population based on aggression exhibited and received by experimental subjects in the course of the 4‐week CPS phase and the statistically identified clusters (C1, N = 58, C2, N = 49, C3, N = 51, C4, N = 14). (c) Scatterplot of the amount of aggression exhibited and received by experimental subjects during the 4‐week CPS highlighting the four statistically identified clusters and associated individual probability density plots that exemplify the probability of receiving and exhibiting a given amount of aggression by individuals within each cluster. (d) Average amount of aggression exhibited [F(3,142) = 184.76, p < .0001, different letters represent statistically significant binary differences at post hoc level] and received [F(3,142) = 188.06, p < .0001] by the four clusters. (e) Survival probability as affected by aggression cluster (log‐rank test, χ2 = 13.6 on 3 degrees of freedom, p < .01; Bonferroni corrected p value for binary comparisons = 0.0083). (f) Age at which 90%, etc. of the population survived, the percent survival at median and maximum (10%) survival as well as Cox regression model examining the contribution of cluster of aggression or achieved status on survival. (likelihood ratio test = 11.36 on 3 degrees of freedom, p = .009915: C2 vs. C1 p = .024, C3 vs. C1, ns, C4 vs. C1, ns) (HR, hazard ratio; CI, confidence interval)
