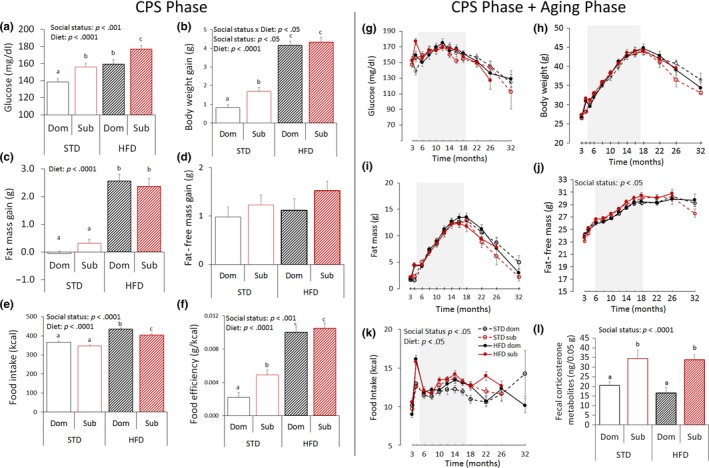
Figure 3.

Achieved status impacts healthspan in mice. (a–f) Healthspan parameters during the 4 weeks of chronic psychosocial stress (CPS) exposure: (a) 4‐hr fasting glucose [diet: F(1,112) = 20.82, p < .0001; achieved status: F(1,112) = 14.59, p < .001]. (b) body weight gain [diet: F(1,113) = 186.71, p < .0001; achieved status: F(1,113) = 4.21, p < .05], (c) fat mass gain [diet: F(1,113) = 132.56, p < .0001]; (d) fat‐free mass gain; (e) food intake [diet: F(1,113) = 111.16, p < .0001; achieved status: F(1,113) = 12.12, p < .0001]; (f) food efficiency [diet: F(1,113) = 134.26, p < .0001; achieved status: F(1,113) = 7.90, p < .01]; (g–l) Healthspan parameters during the entire duration of the study: (g) 4‐hr fasting glucose after; (h) body weight; (i) fat mass; (j) fat‐free mass [achieved status: F(1,108) = 5.73, p < .05]; (k) food intake [diet: F(1,107) = 4.41, p < .05; achieved status: F(1,107) = 6.62, p < .05]; (STD, standard diet; HFD, high‐fat diet). While data are presented for the entire study duration (g–k), they were statistically analyzed only until 12 months after stress (shaded areas), a point upon which the number of missing samples started exceeding 5% thus affecting the analytical power [78]; missing data from animals not surviving to 12 months after stress (3.76%) were not treated nor included in this analysis. Different letters represent statistical differences between groups. (l) Fecal corticosterone metabolites [F(1,50) = 19.8, p < .0001]. N = 8/group. *p < .05, #p < .06. Data represent group mean ± SEM
