
Figure 4.
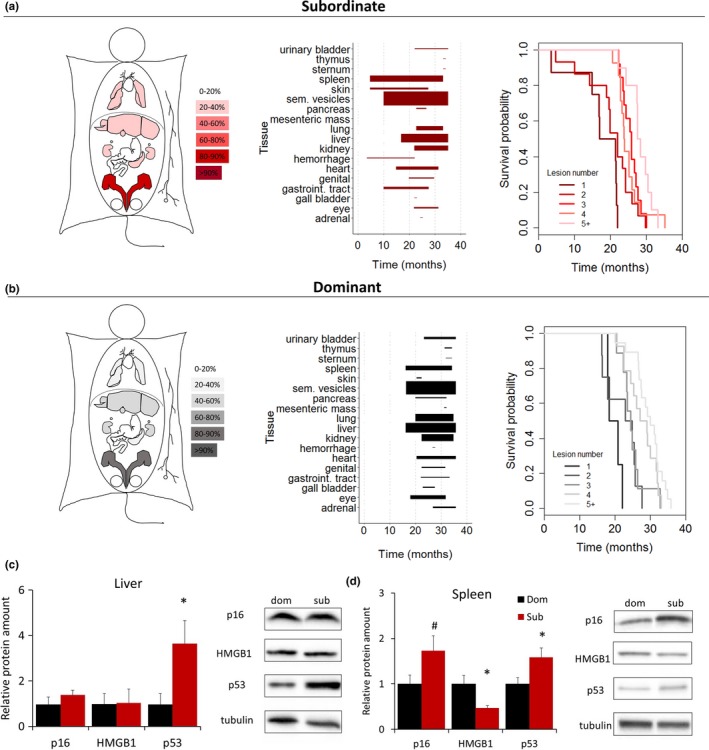
Achieved status affects the onset of aging‐associated organ lesions and cellular markers of senescence. (a, b) Heat map of organ‐specific lesions, age‐dependent distribution of macroscopic dissectible lesions in proportion to their prevalence within each organ, and survival probability as a function of the number of macroscopic dissectible lesions as detected at time of necropsy in dominant and subordinate mice. (c, d) Cell senescence markers in spleen and liver of dominant and subordinate mice [p16Ink4a, HMGB1 (high mobility group box 1), p53] N = 8/group. *p < .05, # p < .06. Data represent group mean ± SEM