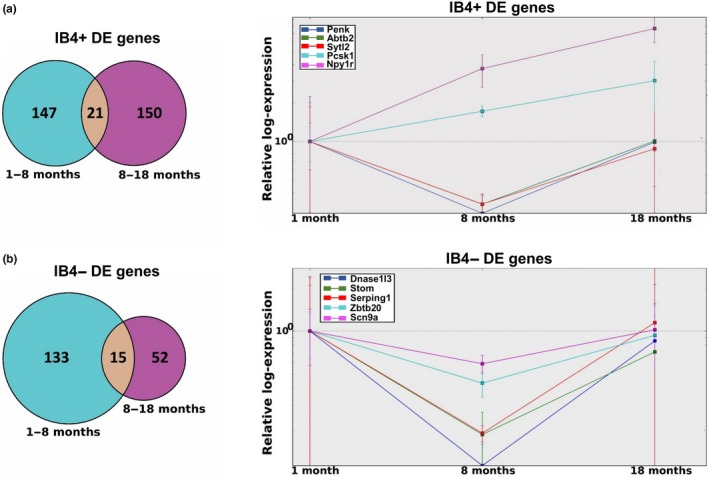
Figure 4.

Relative log‐expression levels at 8 and 18 months reveal recovery patterns for a number of genes. (a) Left panel: 21 IB4+ genes are predicted to be differentially expressed (p ≤ 0.01 for all predictors) from 1 to 8 months and again from 8 to 18 months. Right panel: Five genes with the highest expression levels are presented. Npy1r and Pcsk1 are predicted to increase across all time periods, whereas PENK, Abtb2, and Sytl2 decrease from 1 to 8 months, but return close to their original expression levels by 18 months. (b) Left panel: 15 IB4− genes predicted to be differentially expressed from 1 to 8 months and again from 8 to 18 months. Right panel: Again, five genes with the highest expression levels are presented. Expression levels of all the genes decrease significantly between 1 and 8 months, but return close to their original expression levels by 18 months
