
Figure 5.
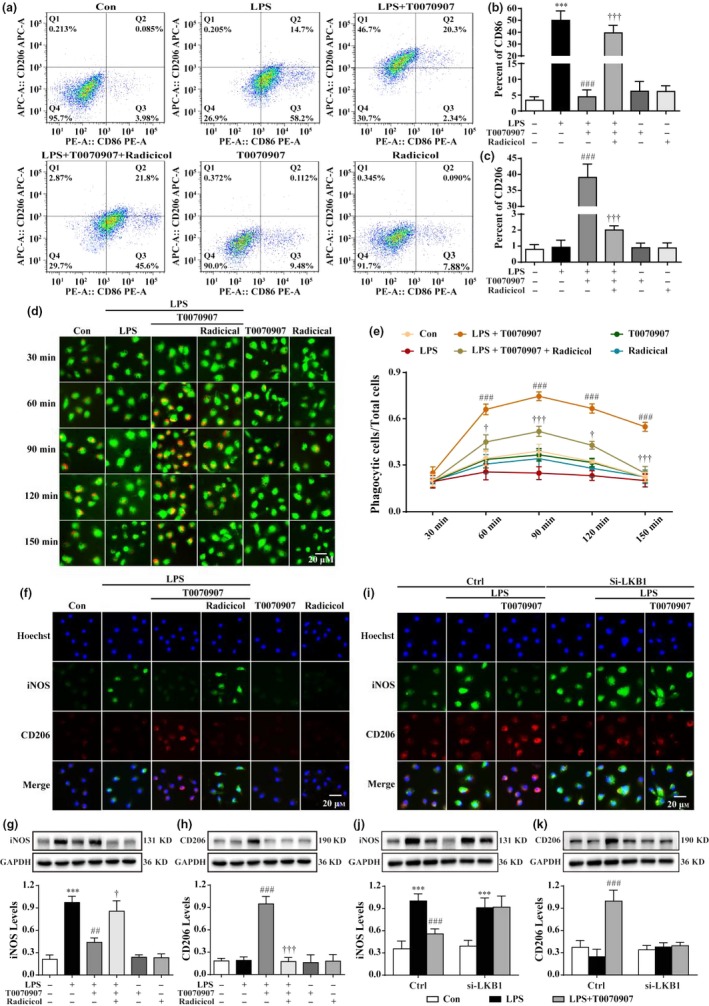
Blocking LKB1 reverses the T0070907‐mediated transition between M1 and M2 phenotypes by suppressing NFκB. After LPS stimulation for 15 min, the LKB1 inhibitor radicicol (0.025 and 0.05 μm) was applied 15 min before treatment with PPARγ antagonist T0070907 for 24 hr. (a) Fluorescence‐activated cell sorting analysis of the microglia in the LPS, LPS+T0070907, and LPS+T0070907 + radicicol groups. Surface expression of CD86 and CD206 was detected in microglia by flow cytometry. The percentage of CD86 (b) and CD206 (c) cells in the microglia was determined. pHrodo™ Green Zymosan BioParticles were added to the cells and imaged after 30, 60, 90, 120, and 150 min. The green staining in the microglial cells was due to Cell Tracker™ Green. (d) The microglial cells showed the time course of red fluorescence increased, documenting the accumulation of pHrodo‐conjugated zymosan bioparticles (1 μm in diameter) in the intracellular acidic environment corresponding to phagosomes. (e) The proportion between the red‐stained cells and the total cells was calculated. Data are presented as mean ± SEM, n = 3, ### p < .001 compared to the LPS group in each time point; † p < .05, ††† p < .001, compared to the LPS+T0070907 group in each time point. Nonfluorescence appeared at a neutral pH outside of the cell. Scale bar = 20 μm. Radicicol (f) and knocking down LKB1 (i) reversed the PPARγ antagonist T0070907‐induced changes in the protein expression of the M1 markers (iNOS, green) and the M2 markers (CD206, red) by immunofluorescence staining. Scale bar = 20 μm. (g, h) Western blotting showed that radicicol prevented the decreases in iNOS and the increases in CD206 induced by T0070907. Data are presented as mean ± SEM, n = 4, ***p < .001, compared to the Con group; ## p < .01, ### p < .001, compared to the LPS group; † p < .05, ††† p < .001, compared to the LPS+T0070907 group. (j and k) Knocking down LKB reversed the PPARγ antagonist T0070907‐induced changes in the protein expressions of iNOS and CD206 by Western blotting. Data are presented as mean ± SEM, n = 4, ***p < .001, compared to Con group, respectively in Ctrl or in si‐LKB1; ### p < .001, compared to LPS group, respectively in Ctrl or in si‐LKB1