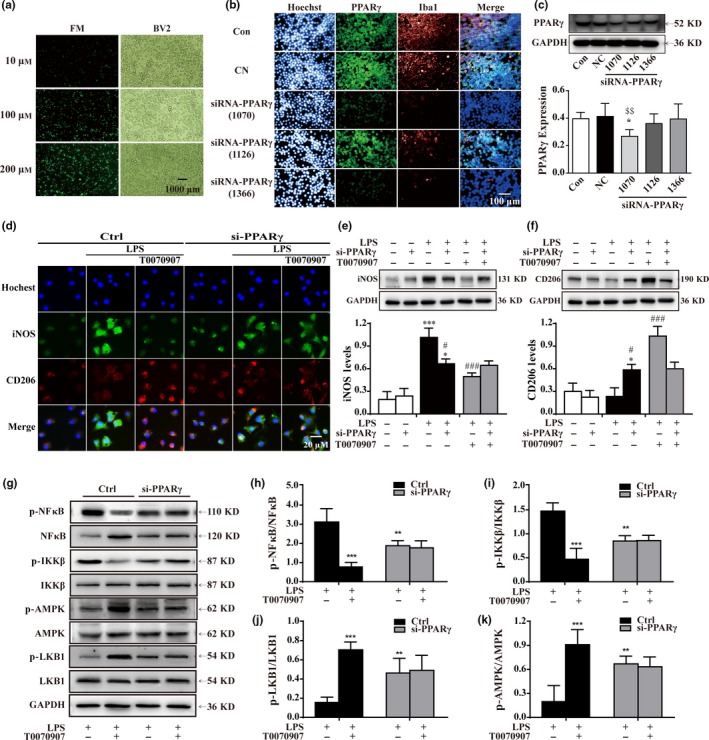
Figure 6.

Knocking down PPARγ reduces the inflammatory response by promoting LKB–AMPK activation. (a) Labeled (FM) with green were used to observe the efficiency of transfection reagent in BV2 cells. Scale bar = 1,000 μm. (b) Images of dissociated microglial cells exposed to scrambled (Con, top panels) or PPARγ siRNA, and labeled with antibodies to Iba1 (red) and PPARγ (green), and colabeled with a nuclear stain (blue). Scale bar = 100 μm. (c) Quantitation of Western blotting data showing declines in PPARγ. Statistical analysis was performed using one‐way ANOVA followed by Bonferroni's post hoc test. Data are presented as mean ± SEM, n = 5, $$ p < .01 compared to the NC group. Microglia were pretreated with si‐PPARγ (500 nm) or vehicle for 24 hr and then stimulated with LPS for 15 min and treated with PPARγ antagonist T0070907 for 24 hr. (d) PPARγ antagonist T0070907 did not influence PPARγ siRNA‐mediated protein expressions of the M1 marker (iNOS, green) and the M2 marker (CD206, red). Scale bar = 20 μm. The experiment was repeated three times. (e, f) Western blotting was used to quantify the expressions of iNOS and CD206 in each group. Data are presented as mean ± SEM, n = 4, *p < .05, ***p < .001, compared to the Con group, respectively in Ctrl or in si‐PPARγ; ### p < .001, compared to the LPS group, respectively in Ctrl in Ctrl or in si‐PPARγ. PPARγ siRNA inhibited the activation of NFκB and IKKβ (e, f, and g). PPARγ siRNA was also associated with a rise in p‐LKB1 (e, h) and p‐AMPK (e, i). The PPARγ antagonist T0070907 did not affect the efficacy of PPARγ siRNA. Data are presented as mean ± SEM, n ≥ 5, **p < .01, ***p < .001, compared to the LPS group in the control
