
Figure 2.
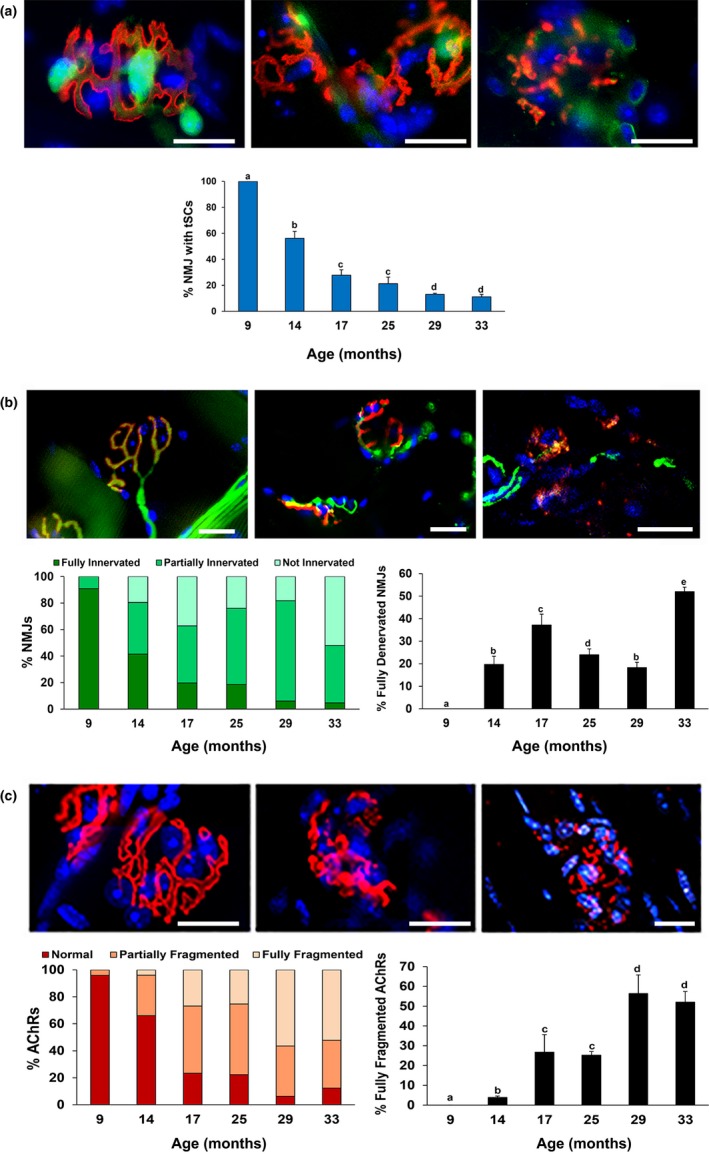
Advancing age results in more frequent NMJ morphological alterations in sternomastoid muscle of WT mice. (a) Top images show decrease in tSC (green) number and staining intensity with age. Graph represents the percentage of NMJs with tSCs. (b) Top images (from left to right side) represent examples of fully, partially, and not innervated (green) NMJs, respectively. Graphs show the proportions of NMJs with the three degrees of innervation (left graph) and the percentage of fully denervated NMJs (right graph). (c) Top images (from left to right side) represent examples of normal, partially, and fully fragmented AChRs (red), respectively. Graphs show the proportion of NMJs with the three classifications of endplate fragmentation (left graph) and the percentage of fully fragmented AChRs (right graph). S100 Ab (for tSCs, a); NF200 Ab (for neurofilaments, b); BTX = α‐bungarotoxin (for AChRs, a–c); DAPI = nuclear staining (blue, a–c); Scale bar = 20 μm. Data ± SD; different letter indicates significant difference; p < .05