Fig. 2.

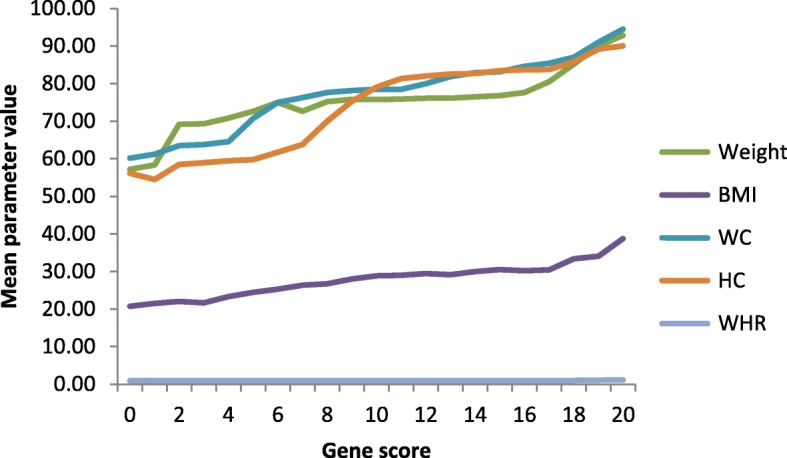
Effect of gene score on the anthropometric traits. The figure shows gene score on x-axis and mean values for the respective parameters on the y-axis. The slope of the lines indicate the trend of the parameter with increasing gene score

Effect of gene score on the anthropometric traits. The figure shows gene score on x-axis and mean values for the respective parameters on the y-axis. The slope of the lines indicate the trend of the parameter with increasing gene score