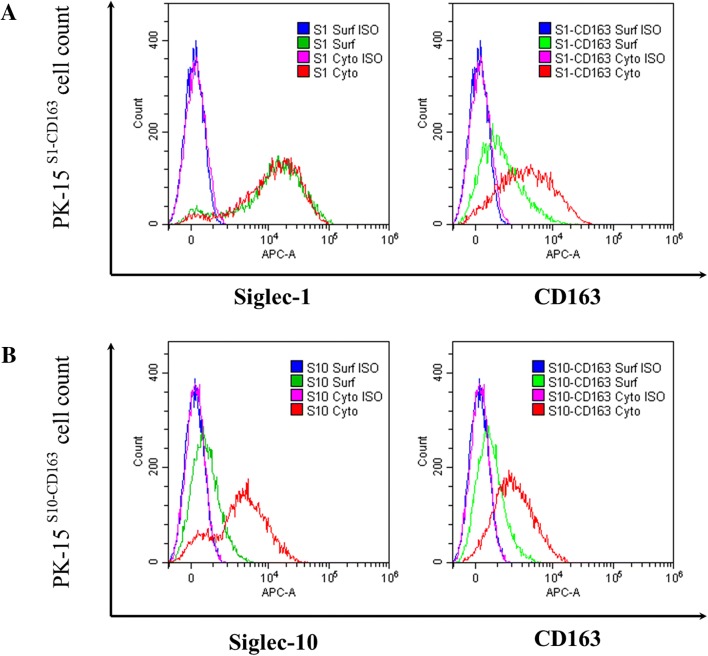
Figure 5.
Flow cytometric analysis of receptor subcellular expression pattern for PK15S1–CD163 and PK15S10–CD163 cell lines. Siglec-1, Siglec-10 and CD163 expression in the cytoplasm and on the plasma membrane of PK15S1–CD163 (A) and PK15S10–CD163 (B) cells were analyzed with flow cytometry. Surf = surface expression; cyto = surface + cytoplasmic expression; ISO = isotype-matched control

