Fig. 3.

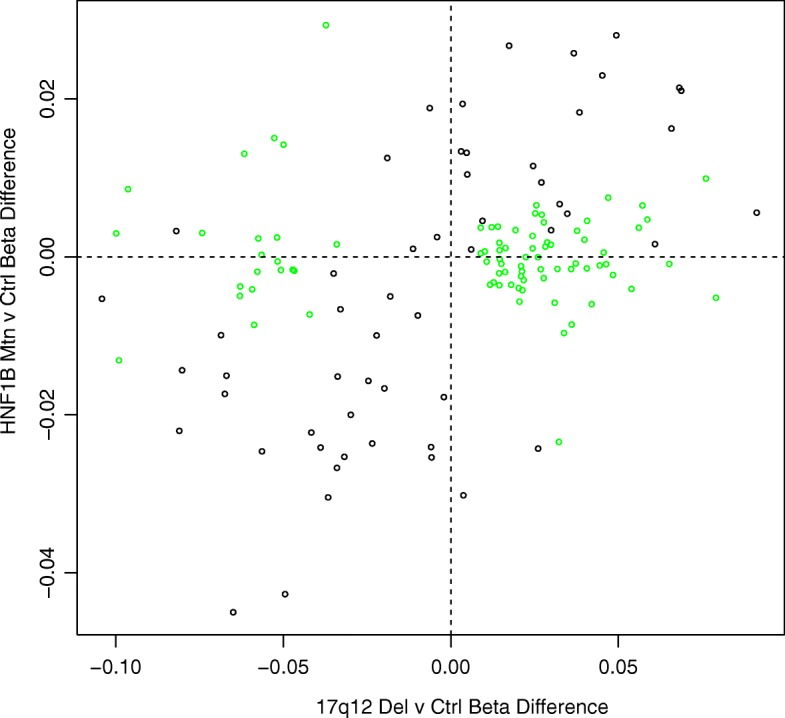
This scatterplot demonstrates the concordance in effect size between the two HNF1B genetic groups compared to controls when probes in the 17q12 deletion region (coloured green) are discounted

This scatterplot demonstrates the concordance in effect size between the two HNF1B genetic groups compared to controls when probes in the 17q12 deletion region (coloured green) are discounted