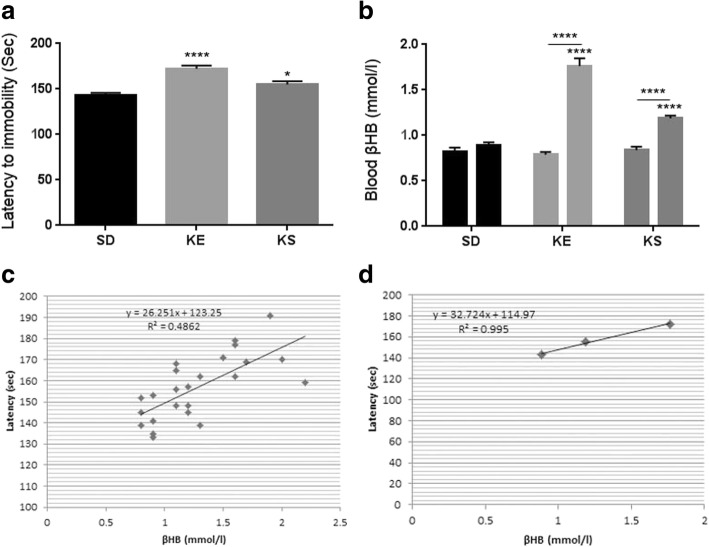
Fig. 3.
a. Latency to anesthesia induction measured by the time until immobility in WAG/Rij rats. In KE and KS groups the latency to anesthesia was significantly longer (p < 0.0001, p = 0.02, respectively) compared to control (standard diet, SD); b. Blood βHB level was significantly elevated in KE and KS groups, compared to control (p < 0.0001, p < 0.0001, respectively) and compared to their baseline (p < 0.0001, p < 0.0001, respectively; interaction: F2,21 = 51.23, p < 0.0001; time: F1,21 = 151, p < 0.0001; treatment: F2,21 = 37.44, p < 0.0001). Bar on left represents baseline value, bar on the right represents value after treatment in each group; c. There was a positive correlation between latency to anesthesia induction and blood βHB levels when all data point was considered (R2 = 0.4862); d. There was a strong positive correlation between latency to anesthesia induction and blood βHB levels when the group means were considered (R2 = 0.995)

