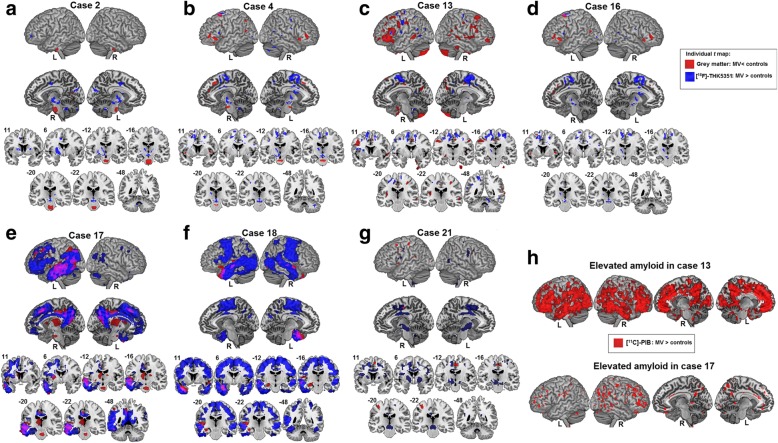
Fig. 4.
Imaging biomarkers in individual mixed variant (MV) PPA cases. a–g Individual t maps representing elevated partial volume corrected [18F]-THK5351 binding (blue) based on SUVR images of each individual MV PPA case contrasted with 20 healthy controls and reduced gray matter (red) compared with 41 healthy controls. h Individual t maps of cases 13 and 17 representing elevated amyloid load based on partial volume corrected [11C]-Pittsburgh Compound B (PIB) SUVR images contrasted to 14 healthy controls. All individual t maps are depicted at a voxel-level uncorrected threshold of P < 0.001 contrasting each MV case against a matched group of healthy controls. L left, R right

