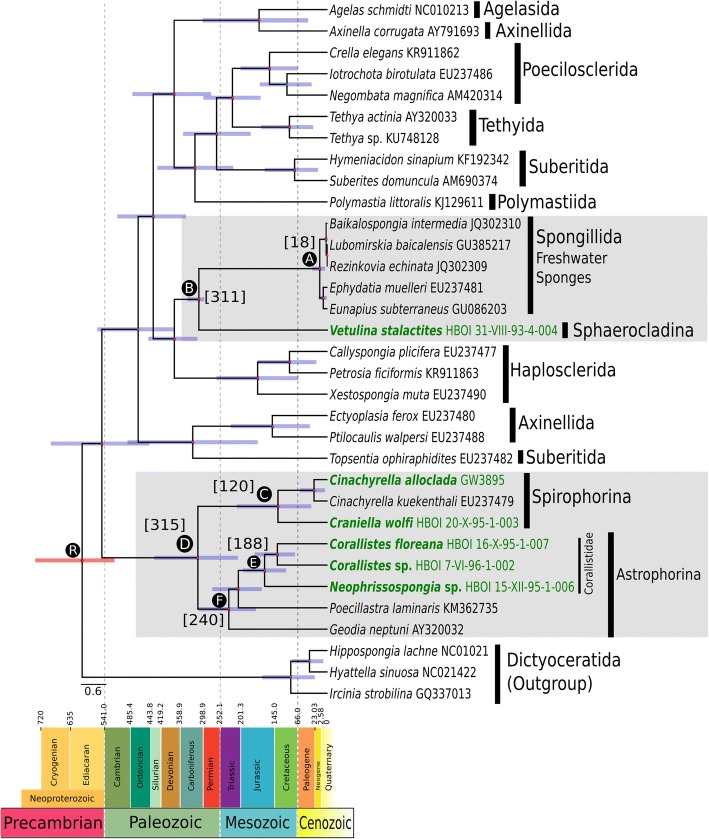
Fig. 1.
Time calibrated phylogeny of Demospongiae based on parameters of BEAST analysis 2 plotted on stratigraphic chart. New sequenced species are in dark green and bold. Taxonomic clades of interest are shaded in light gray. Error bars on node ages are in purple. Nodes of interest are marked with capital letters A-F on the nodes and correspond to node ages listed in Table 1. Numbers in brackets represents mean age estimations in Ma. The capital letter R specifies the root age of the dated phylogeny

