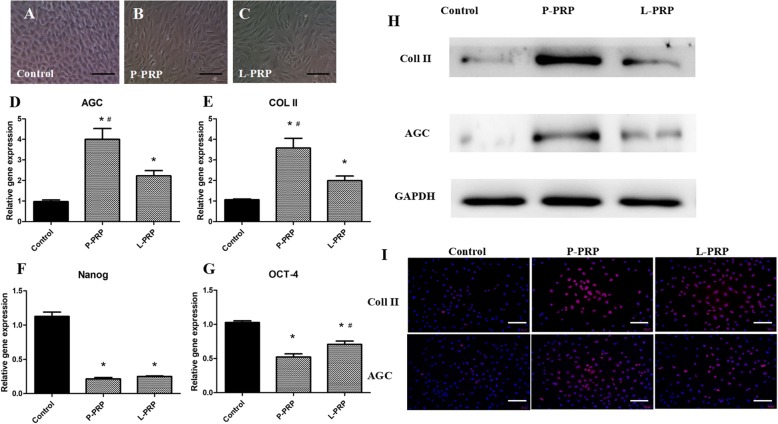
Fig. 6.
P-PRP and L-PRP induce NPSCs differentiation towards active NP cells. In the control group, cells were cobblestone-shaped, a typical feature of NPSCs (a). Either P-PRP or L-PRP treatment changed cell morphology into more elongated NP cells (b, c). P-PRP and L-PRP increased the expression of active NP cell genes, including Col II and AGC, when compared with the control group (d, e). Expression of stem cell marker genes, Nanog and Oct-4, was both reduced in P-PRP- and L-PRP-treated cells (f, g). Western blots validated increased Col II and AGC protein level induced by P-PRP and L-PRP compared with the control group (h). The active NP protein production was highest in P-PRP group. Immunostaining of Col II and AGC was positive in P-PRP and L-PRP group (pink dots), but negative in the control group (i). The highest protein staining intensity (pink dots) was observed in P-PRP group. Nuclei are stained blue with Hoechst 33,342. Significant differences (P < 0.05) are indicated by asterisks. Scale bars, 100 mm. AGC aggrecan, Col II collagen type II, L-PRP leukocyte-platelet-rich plasma, P-PRP pure platelet-rich plasma, NP nucleus pulposus, NPSCs nucleus pulposus-derived stem cells

