. 2018 May 18;9(28):6035–6040. doi: 10.1039/c8sc01697f

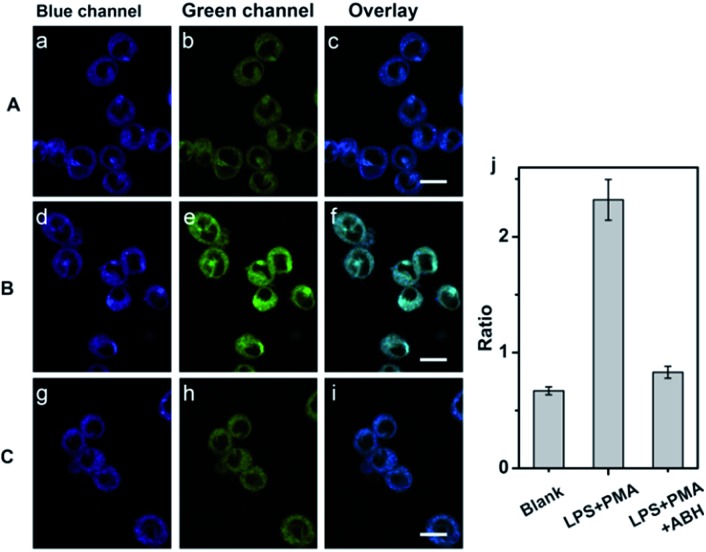
Fig. 3. TP images of endogenous HClO with QClO in RAW 264.7 cells. (a–c) RAW 264.7 cells were incubated with 5.0 μM QClO for 0.5 h. (d–f) RAW 264.7 cells pretreated with HClO stimulants (1.0 μg mL–1 LPS and 1.0 μg mL–1 PMA) for 6 h and then incubated with 5.0 μM QClO for 0.5 h. (g–i) RAW 264.7 cells pretreated with HClO stimulants (1.0 μg mL–1 LPS and 1.0 μg mL–1 PMA) and 200 μM ABH for 6 h and then incubated with 5.0 μM QClO for 0.5 h. (j) Fluorescence intensity ratios from overlay images of c, f and i. The fluorescence intensities were collected at the blue channel (400–500 nm) and green channel (550–600 nm) upon two-photon excitation at 820 nm. Scale bar: 10 μm.

Fig. 3