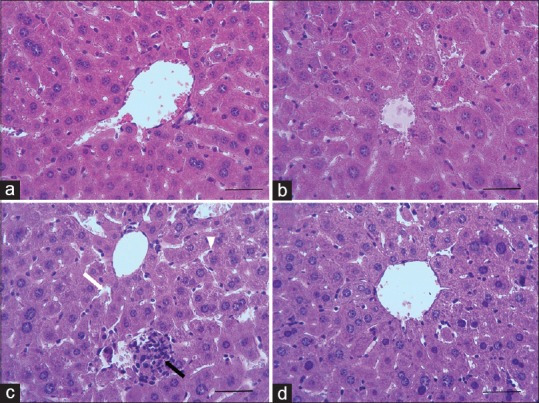
Figure 3.

Photomicrographs showing the effect of OO and As on histological architecture of liver in mice. Control (a), OO (b), As (c), and OO + As (d) groups. Dilation of sinusoids (c, white arrow), granulomatous formations (c, black arrow), slightly hemorrhage (c, black arrow), and Kupffer proliferation (c, head arrow) in CP group (H and E staining, ×400, scale bar = 100 μm; OO=Olive oil, As= Arsenate
