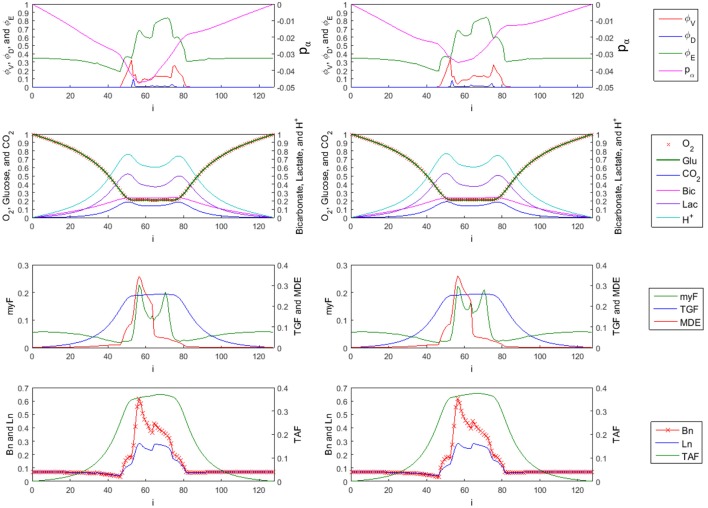
Figure 9.
1-D Profiles of species with trilinear (left side) vs. cubic (right side) interpolation used in FMG-interpolation at time = 10 (sliced at j = k = 58). First row: tumor viable species , dead species , and ECM species . The overall tumor pressure is labeled by pα. Second row: diffusible substances driving the tumor evolution, including oxygen (O2), glucose (Glu), carbon dioxide (CO2), bicarbonate (Bic), lactate (Lac), and hydrogen ions (H+). Third row: Concentration of myfibroblasts (myF), tumor growth factors (TGF), and matrix degrading enzymes (MDE). Fourth row: corresponding density of blood vasculature (Bn), lymphatic vasculature (Ln), and tumor angiogenic factors (TAF). The myofibrobrastic cell species density in tissue (shown in the third row of plots as myF) is computed by . Similarly, the blood and lymphatic vessel densities in tissue (shown in the last row of plots as Bn and Ln) are given by and respectively.

