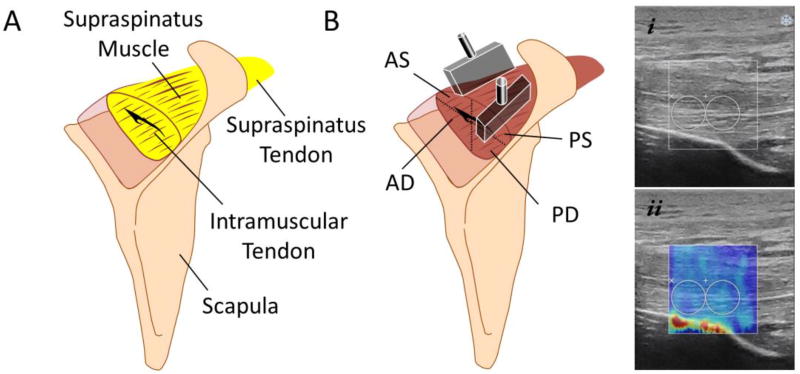
Fig. 1.
A) Schematic of intramuscular fat infiltration. Fatty infiltration, depicted as yellow, was quantified in the whole supraspinatus (SSP) muscle using magnetic resonance imaging (MRI); B) The ultrasound probes were placed in the SSP muscle according to their muscle fiber orientation and SWE measurements were obtained for the 4 muscle regions: anterior-superficial (AS), posterior-superficial (PS), anterior-deep (AD), and posterior-deep (PD) muscular regions. i) Example of B-mode ultrasound image of the SSP muscle, and ii) SWE image of the SSP muscle with the respective region of interest (ROI).

