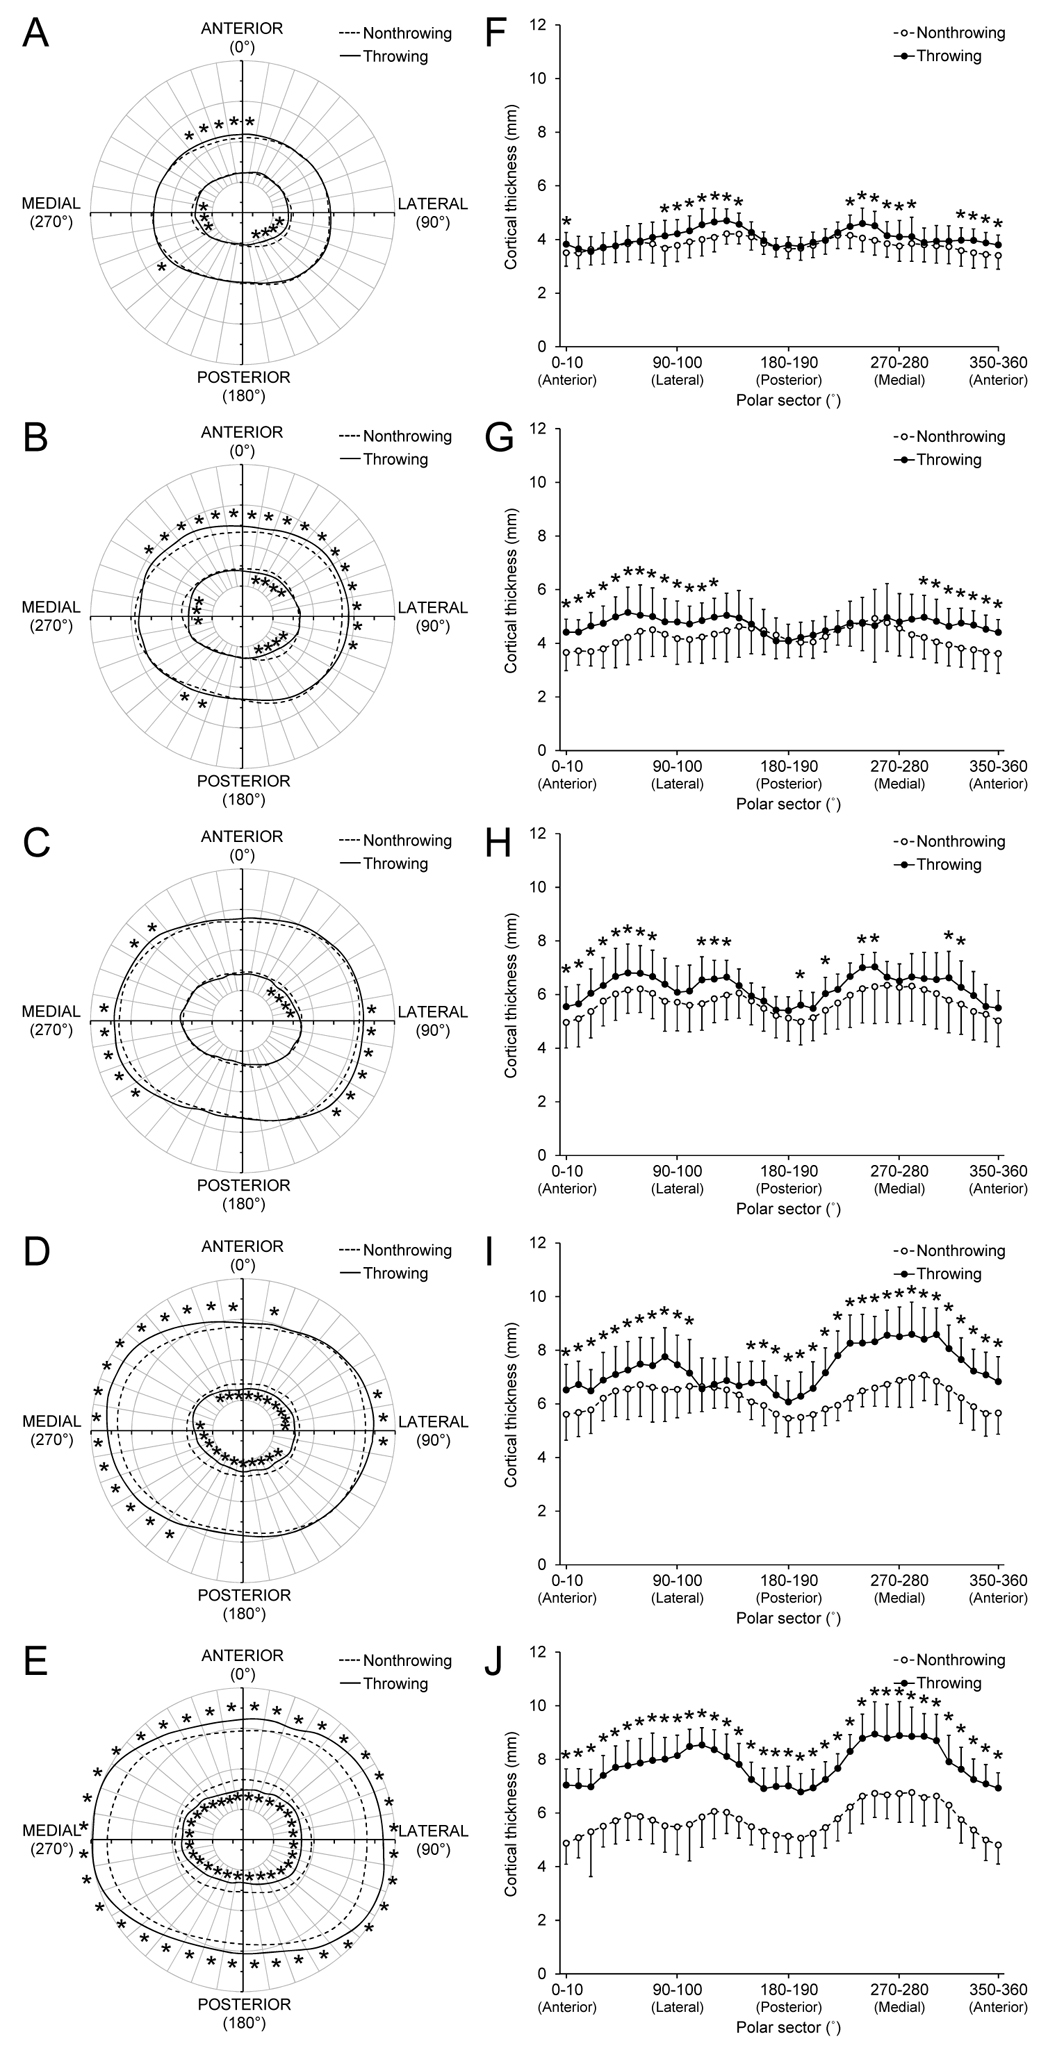
Fig. 2.

Overhead throwing induced regional bone geometry adaptation at the midshaft humerus. Maps of average pericortical and endocortical radii (A-E) and average ± SD cortical thickness (F-J) in 10˚ polar sectors in the throwing (solid lines) and nonthrowing (broken lines) arms of throwers in the PRE- (A, F), PERI- (B, G), POST-EARLY (C, H), POST-MID (D, I), and POST-LATE (E, J) maturity groups. *indicates throwing vs. nonthrowing arm difference within individual sector (p < 0.05), as determined by post-hoc post-hoc paired t-tests with a false discovery rate threshold used to correct for multiple comparisons. Data in each sector were corrected a priori for dominant-to-nondominant arm differences observed in controls to remove any regional side-to-side differences attributable to simple arm dominance.
