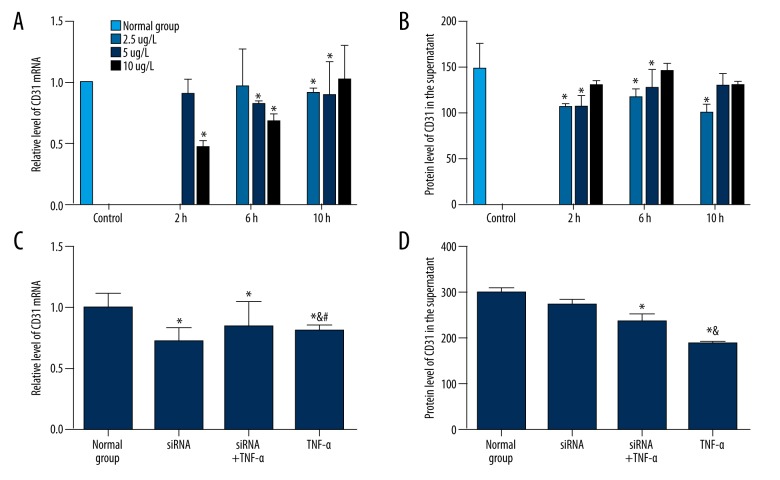
Figure 2.
Effect of human TNF-α on CD31 in HCAEC. (A, B) The level of CD31 was detected after treatment with different concentrations of TNF-α for indicated times. The CD31 mRNA level (A) and protein expression in the supernatant (B) were detected by qRT-PCR and ELISA, respectively. The concentrations of TNF-α is labeled on the right. (C, D) The level of ICAM was detected after treatment with TNF-α and TNF-αR siRNA. The CD31 mRNA level (C) and protein expression in the supernatant (D) were detected by qRT-PCR and ELISA, respectively. Normal group, cells without treatment; TNF-α, cells were treated with 2.5 μg/l TNF-α for 6 h; siRNA, cells were transfected with siRNA of TNF-α receptor; TNF-α+siRNA, cells were first transfected with siRNA of TNF-α receptor and then with 2.5 μg/l TNF-α for 6 h; * P<0.05 compared with normal group; & P<0.05 compared with siRNA group; # P<0.05 compared with siRNA+TNF-α group.

