
Figure 2.
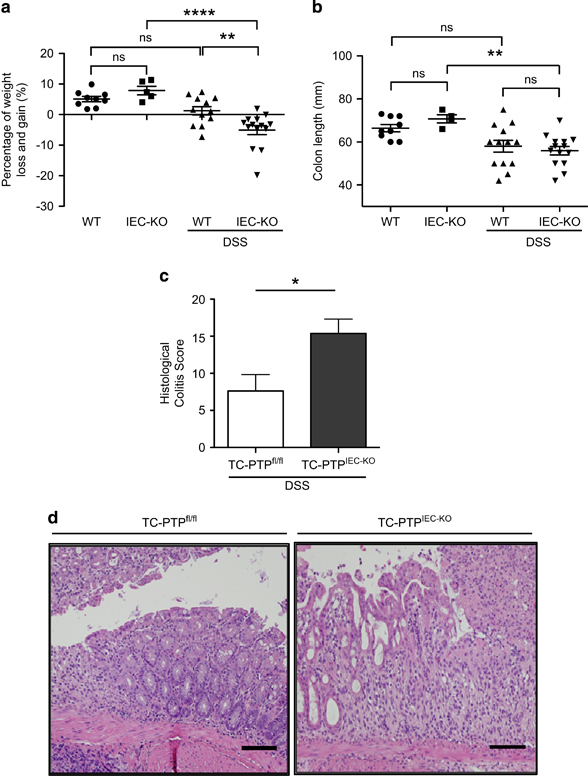
TC-PTPIEC−KO mice are more susceptible to DSS-induced colitis. (a) Percentage of body weight loss and gain of 12 age-matched TC-PTPfl/fl mice (WT, DSS) and TC-PTPIEC−KO mice (IEC-KO, DSS) after 10 days of 5% DSS treatment. In parallel, nine control TC-PTPfl/fl mice (WT) and five TC-PTPIEC−KO mice (IEC-KO) were given regular water. There was a statistically significant difference between the groups as determined by one-way ANOVA (F(3,36)=14.51, P<0.0001). (b) Colon length in millimeters (mm). There was a statistically significant difference between the IEC-KO DSS treated and untreated groups as determined by one-way ANOVA (F(3,36)=6.23, P=0.0016). (c) Histopathological score of controls and TC-PTPIEC−KO mice after DSS treatment based on inflammatory cell infiltration and epithelial injury. Error bars indicate mean±s.e.m. *P<0.05. (d) Representative H&E staining of colonic tissues from control and TC-PTPIEC−KO mice following DSS treatment demonstrating the epithelial damage. n=12. Bar, 50 μM. ANOVA, analysis of variance; DSS, dextran sulphate sodium; TC-PTP, T-cell protein tyrosine phosphatase; WT, wild type.