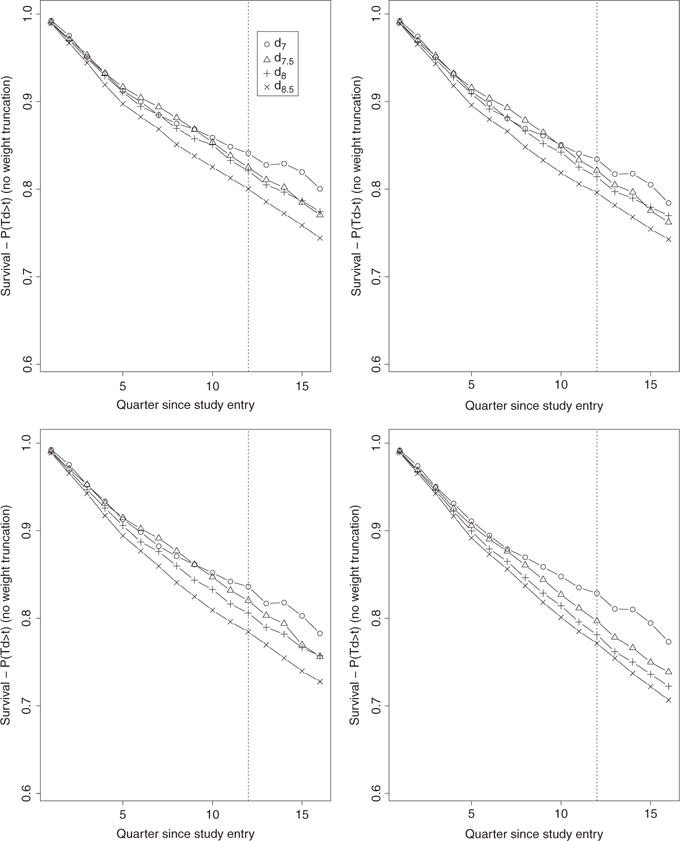
Figure 3.

Bounded IPW estimates (no weight truncation) over 16 quarters of the four survival curves associated with the four TI initiation strategies dθ with θ = 7, 7.5, 8, 8.5. The estimates on the top left, top right, bottom left, and bottom right plots were obtained based on the estimators gn, gn,t, gn,t,x, and gn,t,SL, respectively.
