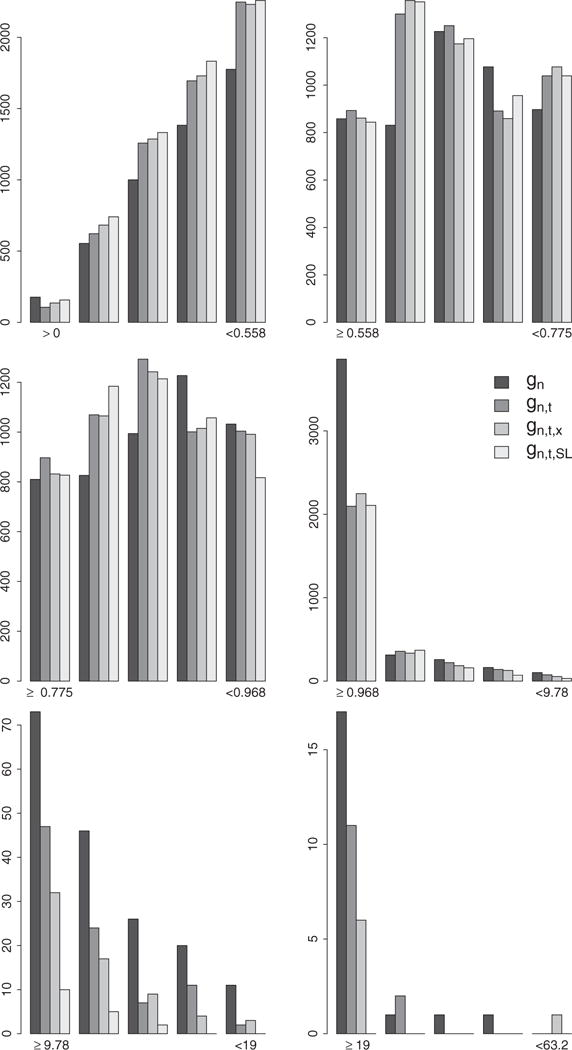
Figure 7.

Distribution of the IP weights assigned to failures observed under any of the four TI initiation strategies in the hazard-based bounded IPW estimation approach. Each plot represents the distribution of the IP weights derived with the estimators gn, gn,t, gn,t,x, and gn,t,SL in the interval indicated by the labels on the x axis. These intervals are defined by the 25th, 50th, 75th, 99th, and 99.9th percentiles of the IP weights derived with the estimator gn.
