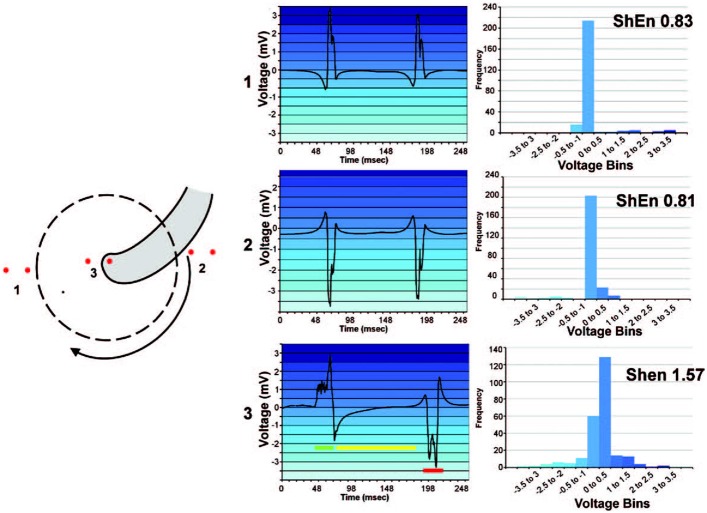
Figure 1.
High ShEn correlates to the pivot of a spiral wave. An example of the relationship between ShEn and the amplitude distribution in a simple rotating wave. An amplitude distribution (histogram) is generated by binning samples of the signal in amplitude bins. Bipoles positioned in location 1 and 2 (at the periphery of the rotating wave) experience consistent activation direction, leading to more regular EGM morphology and a narrow amplitude histogram. Conversely, the bipole at position 3 (at the rotor pivot) experiences sharp local deflection (green), but secondary activity as the wavefront changes direction, including intermediate activity (yellow) and an inverted potential (red). Consequently, signal values are binned over a broader range of amplitudes, leading to higher ShEn. Reprinted from Ganesan et al. (2012) with permission.

