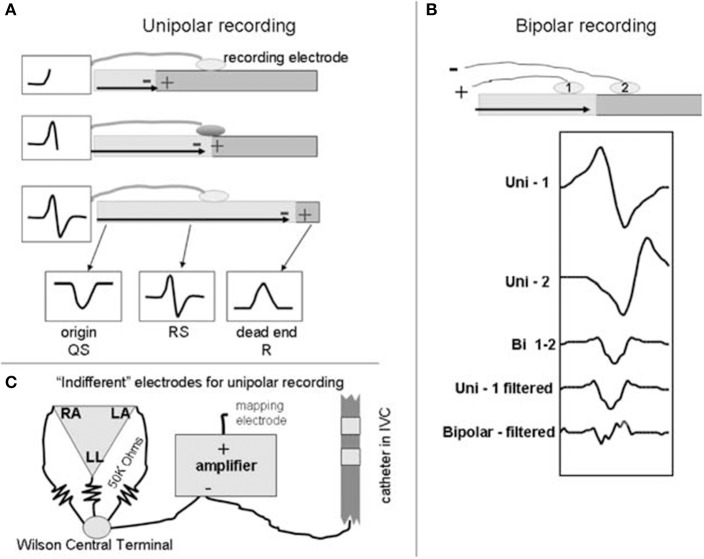
Figure 3.
Basic generation of bipolar and unipolar recordings. A schematic to illustrate the basic generation of bipolar and unipolar electrograms. At the top of (A,B), a horizontal bar is used to represent a sheet of myocardium with depolarization propagating from left to right. Example electrograms are shown in boxes. (A) Unipolar recording: the wavefront propagates toward the electrode, creating a positive deflection, creating an R wave. As the wavefront propagates past the recording electrode, an S wave is detected and hence creates the RS complex (middle schematic). Recording at the right side of the tissue (dead end) creates a monophasic R wave. (B) Bipolar recording: electrodes 1 and 2 are connected to the positive and negative inputs of the amplifier respectively. Electrograms generated via mathematical simulation are shown below the schematic. Compared to the signal from electrode 1 (Uni-1), the signal from electrode 2 (Uni-2) is slightly delayed (due to the wavefront reaching it later) and is inverted due to its connection to the negative input of the amplifier. Addition of the two signals generates the bipolar signal (Bi 1-2) that removes far field signal. Differentiating the signal (Unipolar- filtered) decreases far field component and produces a signal similar to the bipolar electrogram but slightly time shifted. Differentiating the bipolar signal (Bipolar-filtered) produces additional deflections and further complicates the signal. Indifferent electrode configurations are shown in (C). Reprinted from Tedrow and Stevenson (2011) with permission.

