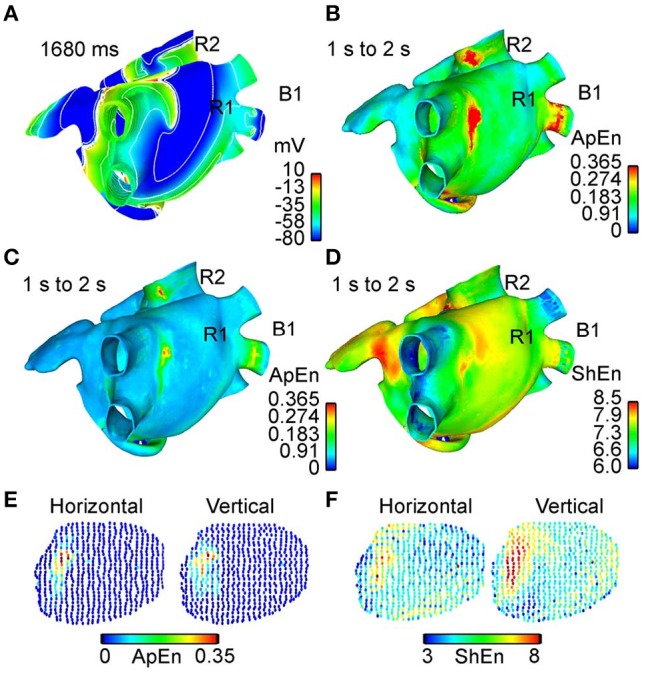
Figure 7.

Comparison between different approaches for rotor mapping. 3D maps showing comparisons between different rotor mapping tools as computed by Ugarte et al. (2014). (A) Map using the action potential wavefront delimited by contour lines over the 3D atrial model (human) extracted from an interval between 1 and 2 s of simulation. Spinning wavefronts around one point defines the stable rotors R1 and R2. (B) Dynamic ApEn map calculated using standard parameters and the unipolar EGM. (C) Dynamic ApEn maps using optimized parameters from Ugarte et al. and unipolar EGM. (D) ShEn map using unipolar EGM. It can be noted that map (C) illustrates better sensitivity for identifying rotor tip. (E) Dynamic ApEn map calculated from optimized parameters and the bipolar EGM with vertical and horizontal orientation. The region corresponds to the vicinity of the rotor R1. (F) ShEn map using the bipolar EGM obtained from vicinity of R1. Reprinted from Ugarte et al. (2014) with permission.
