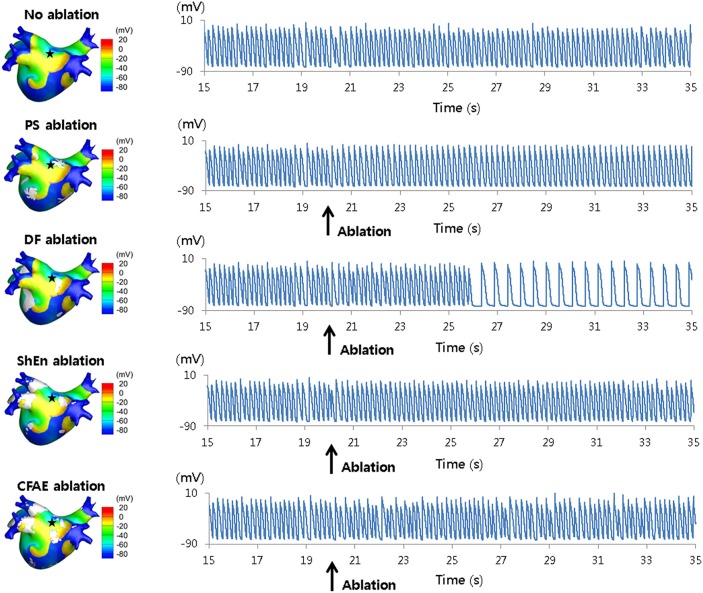
Figure 8.
3D voltage maps and action potential curves during virtual ablation using phase singularity (PS), dominant frequency (DF), Shannon entropy (SE), and complex fractionated electrogram (CFAE) approaches. Results from simulated ablation using PS, DF, SE, and CFAE, as performed by Hwang et al. (2016). 3D heart voltage maps are shown on the (Left), with the black star indicating the action potential recording site. Action potential curves are shown on the (Right). Only simulated DF ablation resulted in changes of the action potential, converting AF into atrial tachycardia. Reprinted from Hwang et al. (2016) with permissions.

