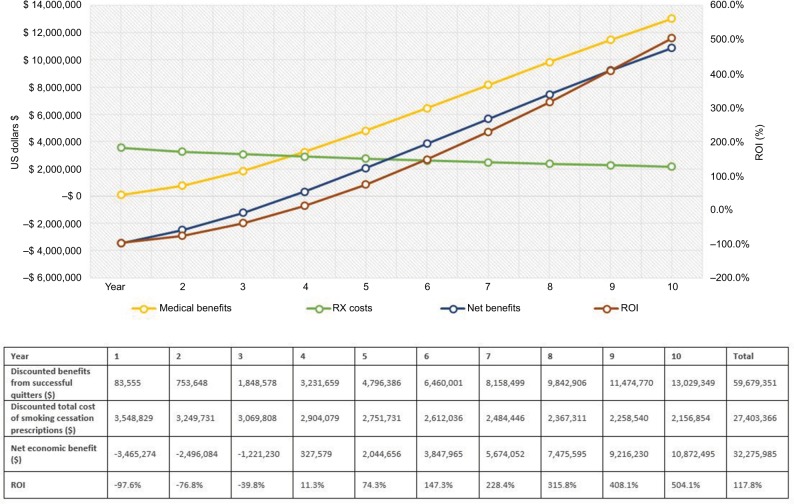
Figure 2.
Outcome measures for commercial payers.
Notes: The graph illustrates the trend for costs, benefits, and ROI ratio over 10 years. The green line represents the trend for smoking cessation prescription drug costs. The yellow line describes the medical benefits of smoking-attributable medical costs avoided. The blue line represents the net economic benefits (medical benefits – costs of smoking cessation prescriptions). The dark red line shows the trend for ROI change. The horizontal axis shows the time in years; the vertical axis on the left shows cost in 2017 US$; the vertical axis on the right demonstrates percentage (%) for ROI ratio = net divided by program costs. Descriptions of key outcome measures reported in the table: (1) Total medical benefits from successful quitters were estimated from smoking-attributable medical costs per patient by sex and age group (ie, 18–34, 35–49, 50–64, and 65+).7,25; (2) The total cost of smoking cessation prescription medications was calculated from the utilization and pricing of smoking cessation medications; (3) Net savings (net economic benefits) were estimated as 1) minus 2), that is, the benefits in excess of estimated costs for implementing smoking cessation prescription coverage program; (4) ROI outcome measure was calculated by (1) minus (2), that is, the excess benefits divided by total costs of smoking cessation prescriptions. The net present value of costs and benefits is discounted 3% for future costs.
Abbreviations: ROI, return on investment; RX, prescription.

