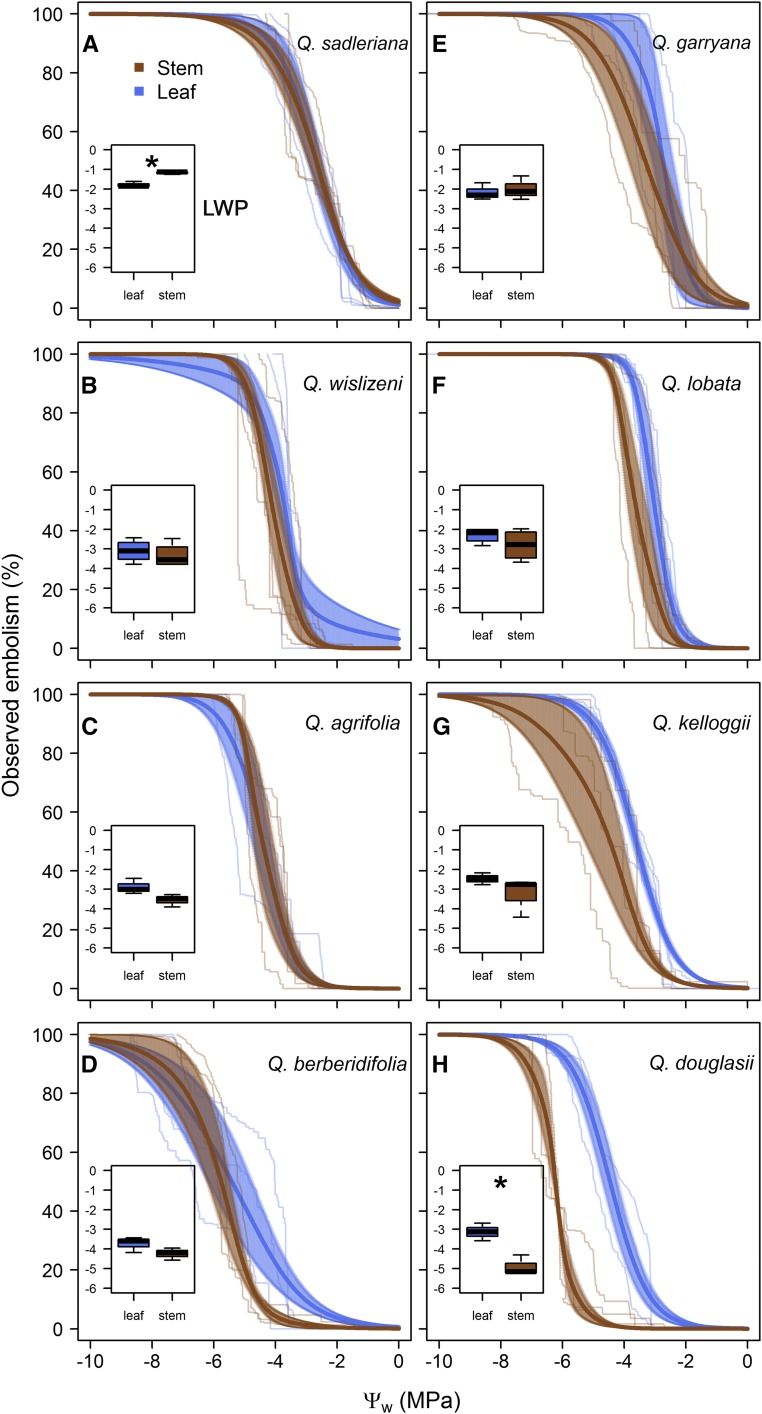
Figure 2.
Optical vulnerability curves for leaves (blue) and stems (brown) of all eight sample Quercus species: Q. sadleriana (A; the least resistant to embolism); Q. wislizenii (B); Q. agrifolia (C); Q. berberidifolia (D); Q. garryana (E); Q. lobata (F); Q. kelloggii (G); and Q. douglasii (H). Solid dark lines and shading indicate the mean observed embolism ± se for each tissue type (n = 3). Light lines indicate raw curves for each individual. The insets are box plots showing the mean Pe for leaves and stems for each species. Asterisks indicate species in which the values for leaves and stems were significantly different.

