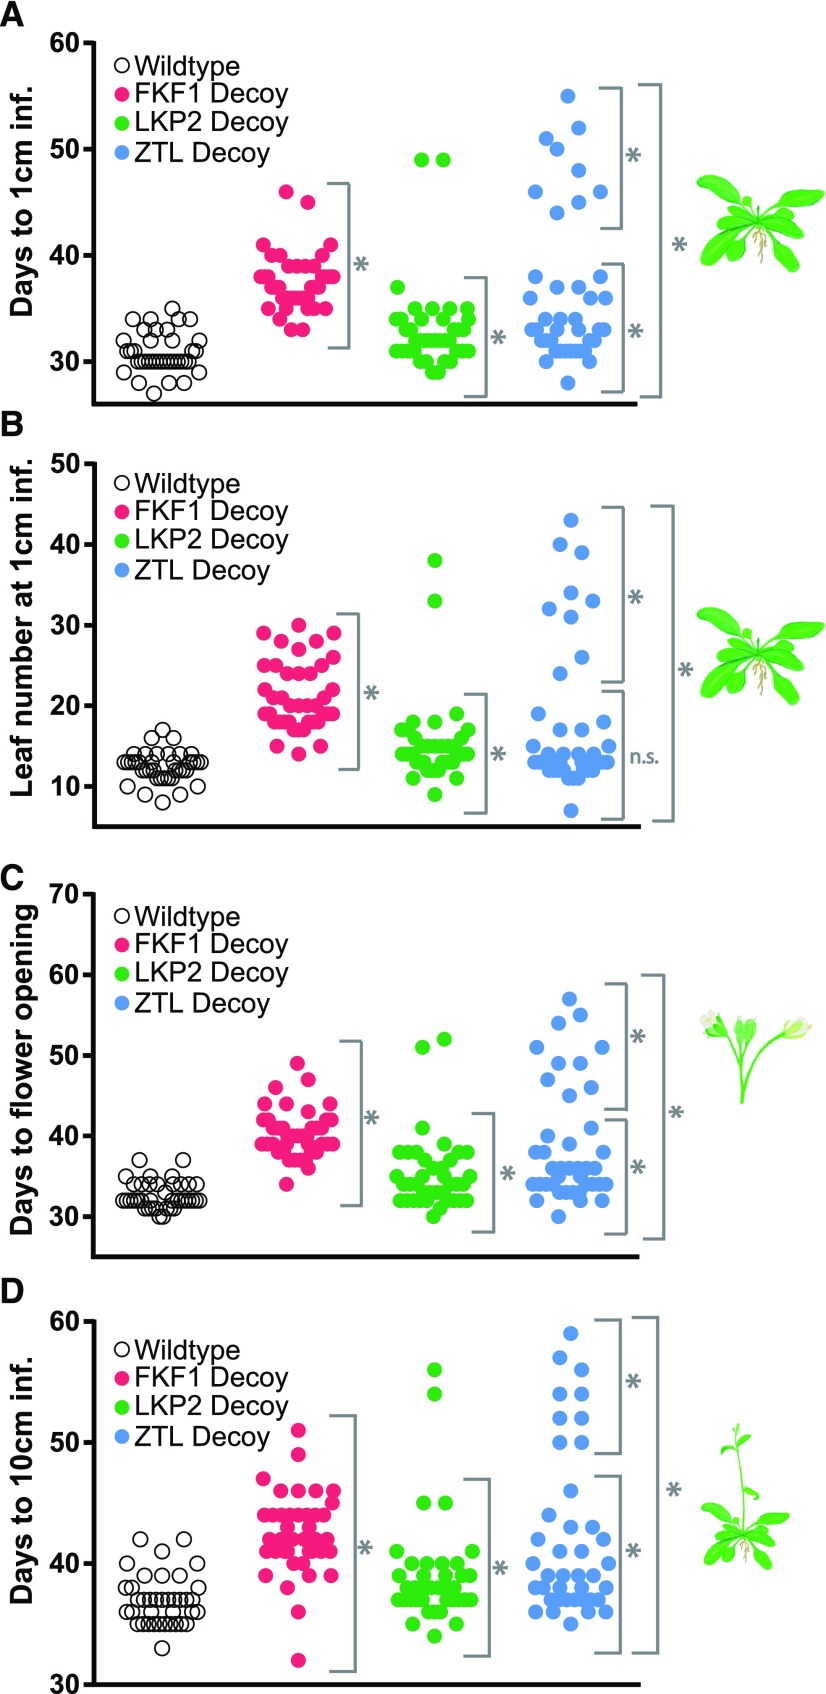
Figure 3.
Decoys reveal the genetic contributions of redundant F-box genes to seasonal flowering time. Flowering time was measured for the wild type and the T1 generation ZTL (n = 40), LKP2 (n = 38), and FKF1 (n = 40) decoys using four parameters: number of days for the inflorescence stem to reach 1 cm (A); number of rosette leaves when the inflorescence stem reaches 1 cm (B); number of days until the first flower opening (C); and number of days for the inflorescence stem to reach 10 cm (D). Gray brackets define individual groups used for statistical testing against the wild-type control (n = 38) using a Welch’s t test with a Bonferroni-corrected α of 2 × 10⁻³. *, P < α; n.s., P > α. Two lines with a significantly later flowering phenotype than the others were removed from LKP2 statistical analysis and could not be analyzed separately due to the limits of statistical testing on small sample sizes.

