Figure 8.
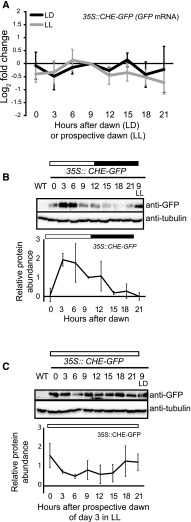
CHE protein cycles over daily time courses. A, CHE mRNA expression was measured using RT-qPCR in a 35S::CHE-GFP transgenic line in LD (12 h of light/12 h of dark) and LL growth conditions. B and C, CHE protein levels were measured using immunoblotting in a 35S::CHE-GFP transgenic line in LD (B) and LL (C). All plants were grown in LD conditions for 12 d and then transferred to the aforementioned light conditions for 48 h prior to the start of the time course. Sampling began at dawn or prospective dawn of day 14. ZT9 samples are presented for cross-comparison of relative protein levels between LD and LL time courses. All quantifications are averages of three biological replicates, with error bars showing sd. WT, Wild type.

