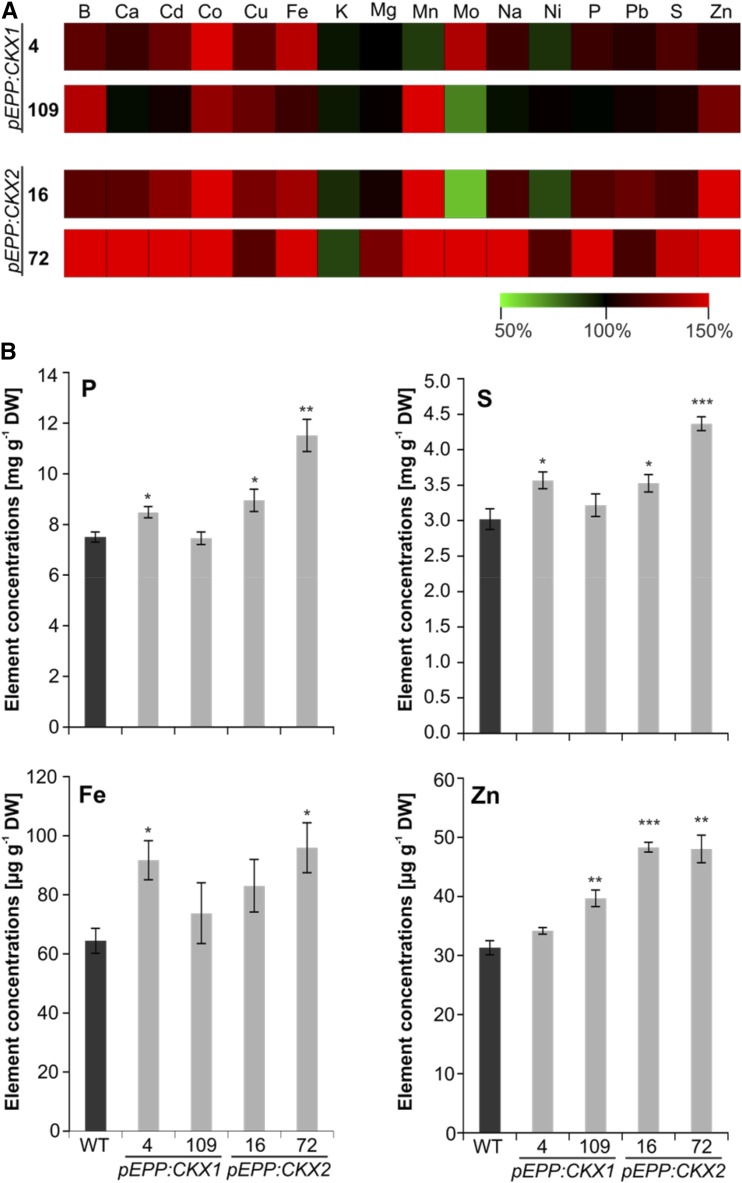
Figure 4.
Mineral element concentrations in shoots. A, Relative changes in mineral element concentrations in transgenic lines compared with the wild type (WT). The concentration of each mineral element in wild-type shoots was set to 100%, and relative differences in transgenic lines are shown in a heat map generated using Multiexperiment Viewer version 4.9 (Saeed et al., 2003). The complete data set is shown in Supplemental Table S2. B, Concentrations of P, S, Fe, and Zn in 8-week-old soil-grown shoots. Four biological replicates for each genotype were analyzed, each containing shoots from two to three plants. Data represent means ± se. Asterisks indicate significant differences from the WT as determined by a two-tailed Student’s t test (*, P < 0.05; **, P < 0.01; and ***, P < 0.001). DW, dry weight.

