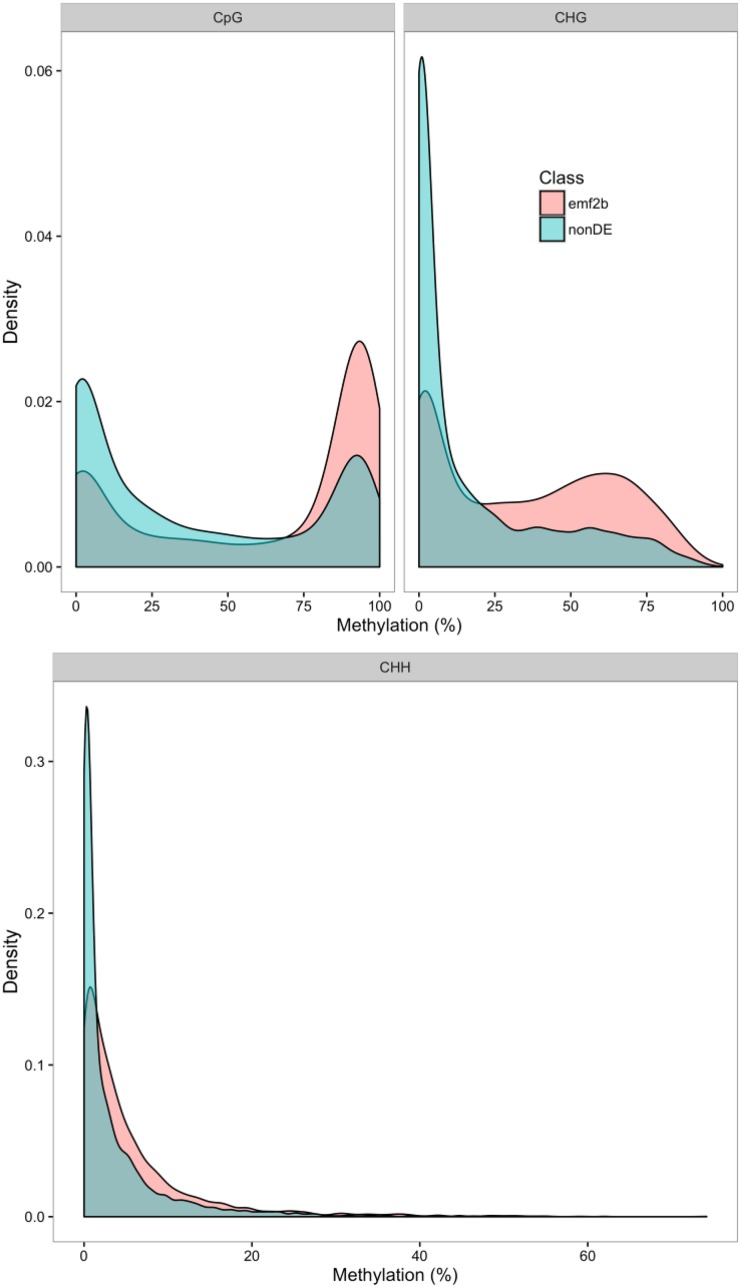
Figure 10.
Kernel density plots show the distribution of average DNA methylation levels in rice leaf tissue among the 2,594 lincRNAs derepressed in emf2b panicles (emf2b) and the 2,808 nondifferentially expressed lincRNAs (nonDE) as compared with wild-type panicles. The CpG and CHG contexts show clearly bimodal distributions, with a greater proportion of lincRNAs contributing to the high methylation peak for the emf2b class but not for the nondifferentially expressed class. For the CHH context, there is a relative bias toward higher DNA methylation for the emf2b class as compared with the nondifferentially expressed class.

