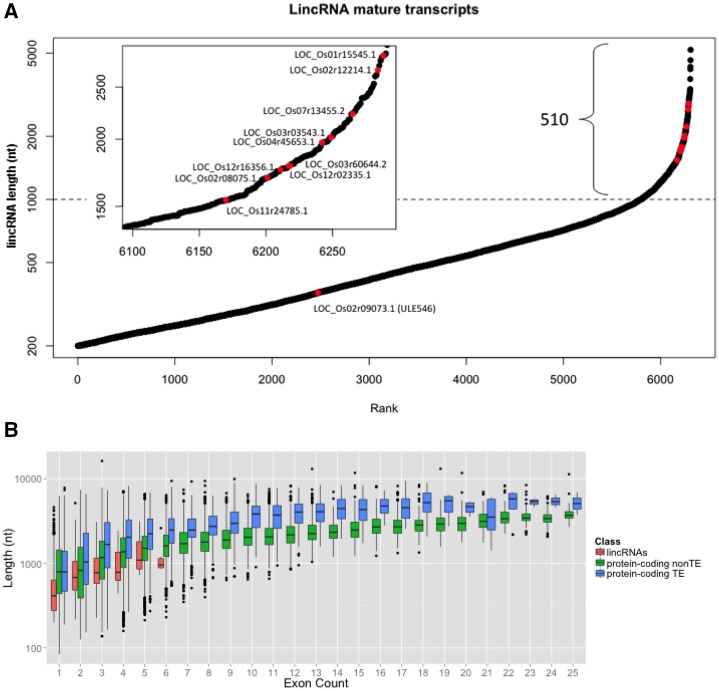
Figure 3.
A, Rank plot shows the size distribution of detected lincRNAs. While many lincRNAs are less than 1 kb, several of those chosen for additional RT-PCR confirmation were mostly larger than 1 kb (inset). B, Box plots show that transcript length roughly correlates with the number of exons within each of the three transcript classes. LincRNAs may have fewer exons as compared with the protein-coding transcripts (TE and non TE). nt, Nucleotides.

