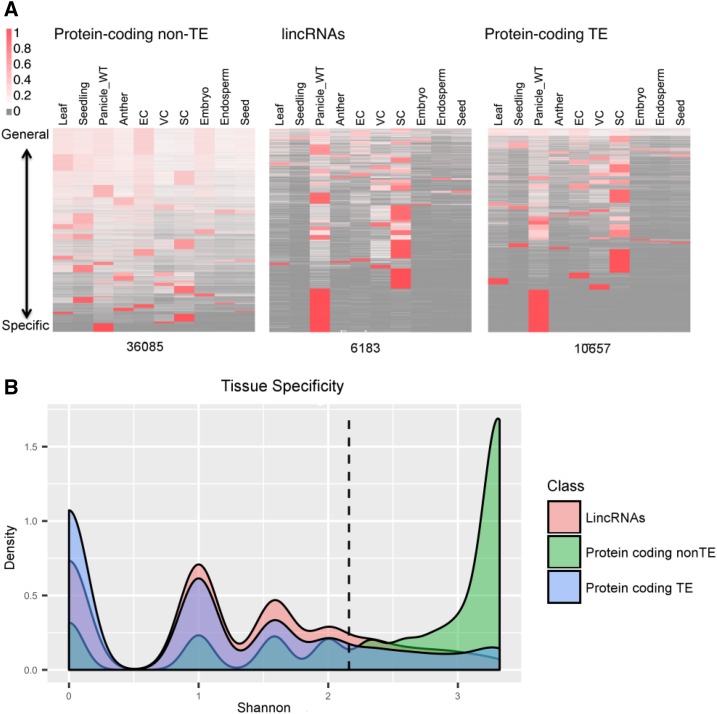
Figure 4.
Tissue specificity is shown for 36,035 non-TE protein-coding genes, 6,183 lincRNAs, and 10,657 TE protein-coding genes via heat map (A) where EC, VC, and SC correspond to Egg Cell, Vegetative Cytoplasm (of mature pollen) and Sperm Cell (of mature pollen), respectively, and more clearly by a density plot of Shannon entropy (log2 of the number of tissues with detected expression; B). For the heat maps, genes were clustered into 33, 33, and 35 groups, respectively, and the expression level in RPKM was row normalized to 1 for each locus. The expression level is shown as a spectrum with high expression (red) to low expression (white), and the absence of reads also is indicated (gray). For the density plots, predominant expression within one, two, and three tissues shows up as peaks at 0, 1, and 1.58. For non-TE protein-coding genes, the peak occurs at a position greater than a value of 3, corresponding to at least eight of the tissues with detectable expression. Most lincRNA and TE loci (82.3% and 82.6%) are expressed in four or fewer tissues/cell types (left of the dashed line), as compared with non-TE protein-coding genes, for which 71.6% of loci are expressed in more than four tissues/cell types (right of the dashed line). WT, Wild type.

