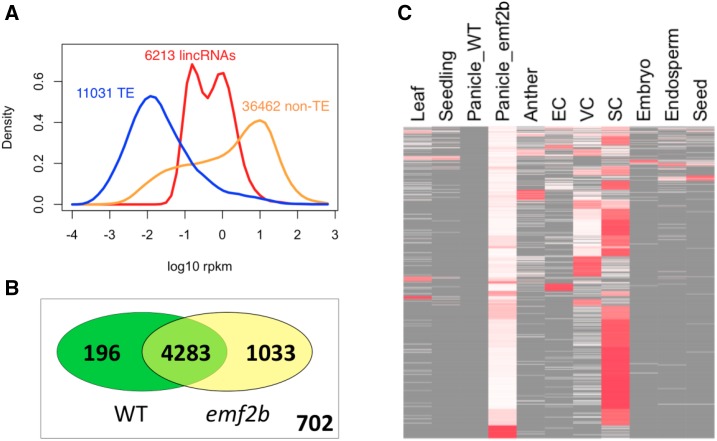
Figure 5.
A, Expression value distribution plots made using data from the 10 wild-type tissues but also including data from emf2b mutant panicles, which results in a bimodal distribution for the lincRNAs, suggesting that the loss of EMF2B in panicles results in derepression of many lincRNAs. B, Venn diagram showing which of the 6,214 loci correspond to lincRNAs with and without RNA-seq reads in the data for wild-type (WT) panicles and emf2b mutant panicles. The set of 702 lincRNAs refers to those not present in panicles. C, Heat map of 1,033 lincRNAs having reads in emf2b mutant panicles but not in wild-type panicles. Heat colors (white to red) correspond to RPKM values row normalized to 1, with the absence of reads also indicated (gray). The samples EC, VC, and SC correspond to Egg Cell, Vegetative Cytoplasm (of mature pollen), and Sperm Cell (of mature pollen), respectively. The greater amount of red in the column SC shows that many of the lincRNAs expressed in the emf2b mutant panicles are most highly expressed in sperm cells.

