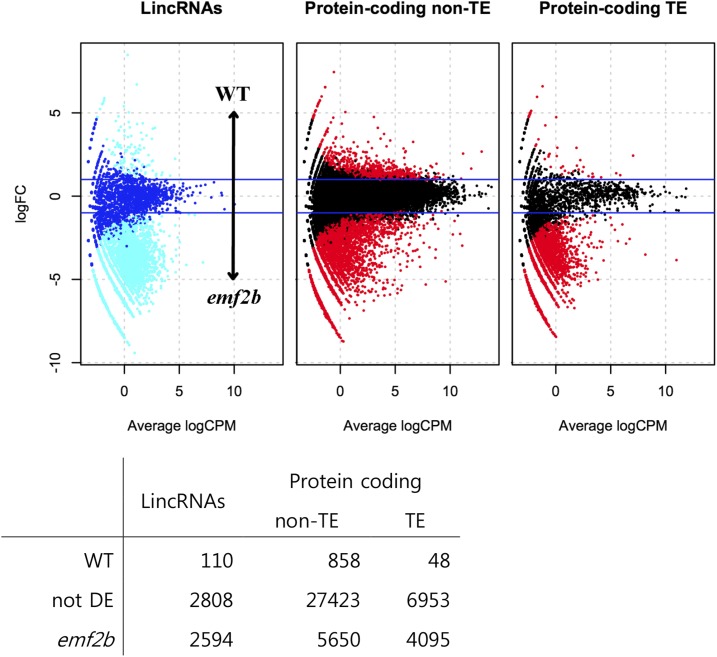
Figure 6.
The results of differential expression analysis between wild-type and mutant panicles are shown graphically as minus versus average (MvA) plots (top), with expression level on the x axis (log of counts per million) versus log fold change (logFC), and as a numbers table of differentially expressed (DE) genes (bottom). Transcripts from both coding and noncoding loci have higher expression in emf2b mutant panicles (bottom row of table and negative values on the log fold change scale of plots) as compared with wild-type (WT) panicles. However, the proportions of affected loci in each class differ, with 47.1%, 16.7%, and 36.9% derepressed loci for lincRNAs, non-TE protein-coding, and TE protein-coding loci, respectively.

