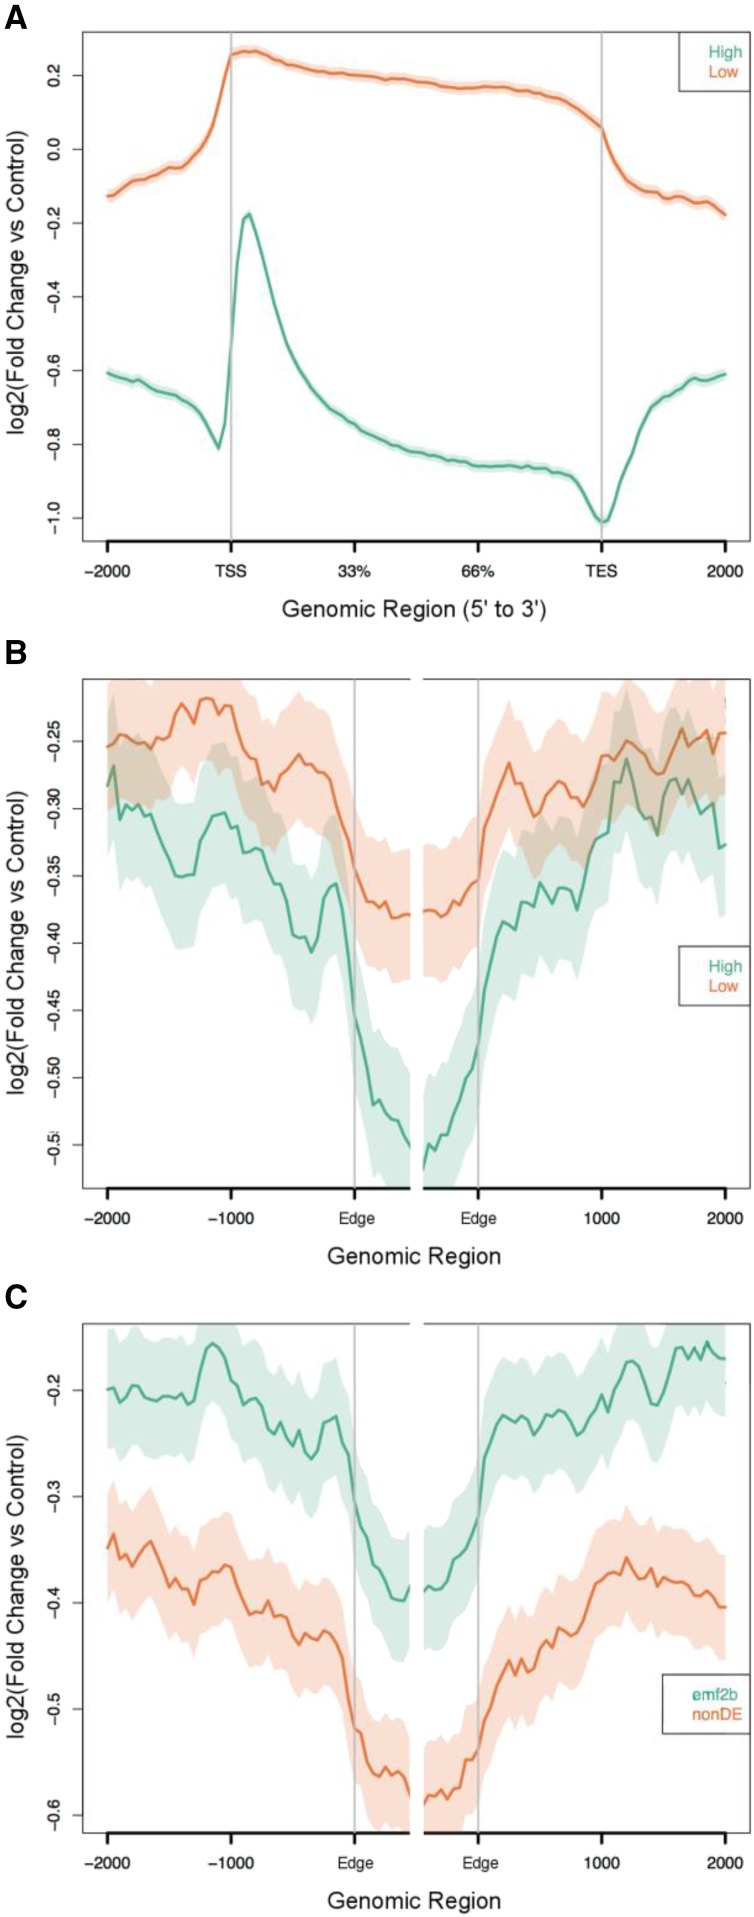
Figure 9.
Relative H3K27me3 enrichment profiles (ChIP-seq versus input) are shown for non-TE protein-coding genes (A) and lincRNA loci (B and C), where the TSS and TES are shown for the protein-coding loci and, for the lincRNAs, the edges of the transcripts (Edge) are shown where strand information was not available. Within the graphs are plotted two lines, one for each of two classes of loci, where the higher line shows greater enrichment of DNA sequences via ChIP-seq (relative to the input chromatin) and the shaded band indicates the 95% confidence interval (see “Materials and Methods”). For the comparison of high versus low expression classes, both the non-TE protein-coding loci (A) and lincRNAs (B) show greater enrichment of H3K27me3 for the low expression class. For the lincRNA plots (B and C), relative to the lincRNA body, clearer separation is shown for the flanking regions of the emf2b/nondifferentially expressed (nonDE; 2,758/3,456 loci) comparison than for the high/low (2,594/2,808 loci) expression comparison, for which the 95% confidence intervals overlap.

