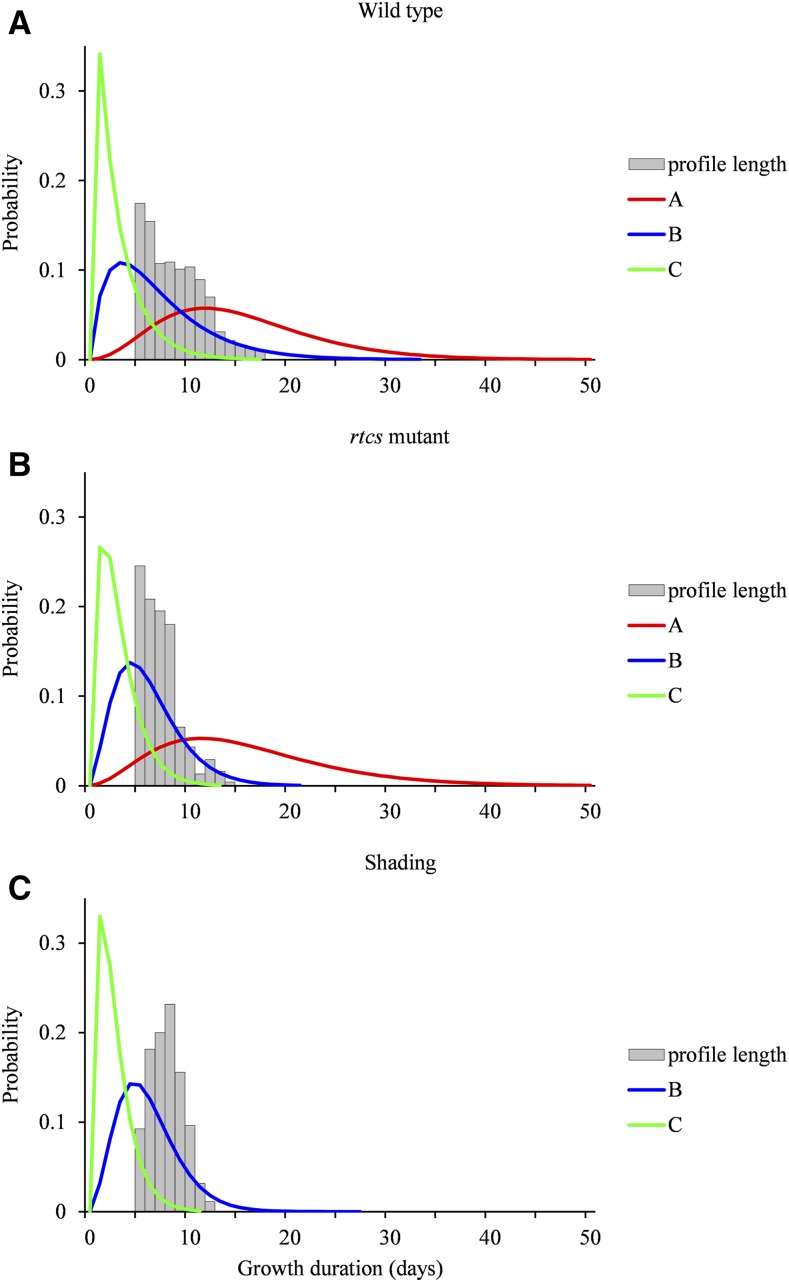
Figure 7.
Growth phase duration distributions in wild-type, rtcs mutant, and shaded maize. Distributions were estimated for lateral root types A, B, and C within the SMS-LM for wild-type (A), rtcs mutant (B), and shaded (C) maize. The relative frequency distributions of the lengths of growth rate profiles are drawn to illustrate the censoring level. Only lengths ≥ 5 corresponding to lateral roots used to build the SMS-LMs are shown.

