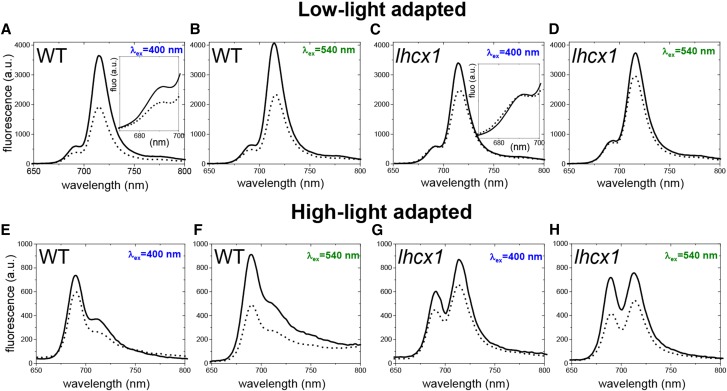
Figure 5.
Reconstructed steady-state emission spectra in unquenched (solid lines) and quenched (dashed lines) states at 77 K of LL-adapted (top row) and HL-adapted (bottom row) cells. Excitation wavelengths and analyzed strains are indicated in every graph. Spectra were reconstructed as explained in “Materials and Methods”. a.u., arbitrary units. Insets in A and C indicate comparison of reconstructed steady-state emission in the 670-700 nm spectral region.

