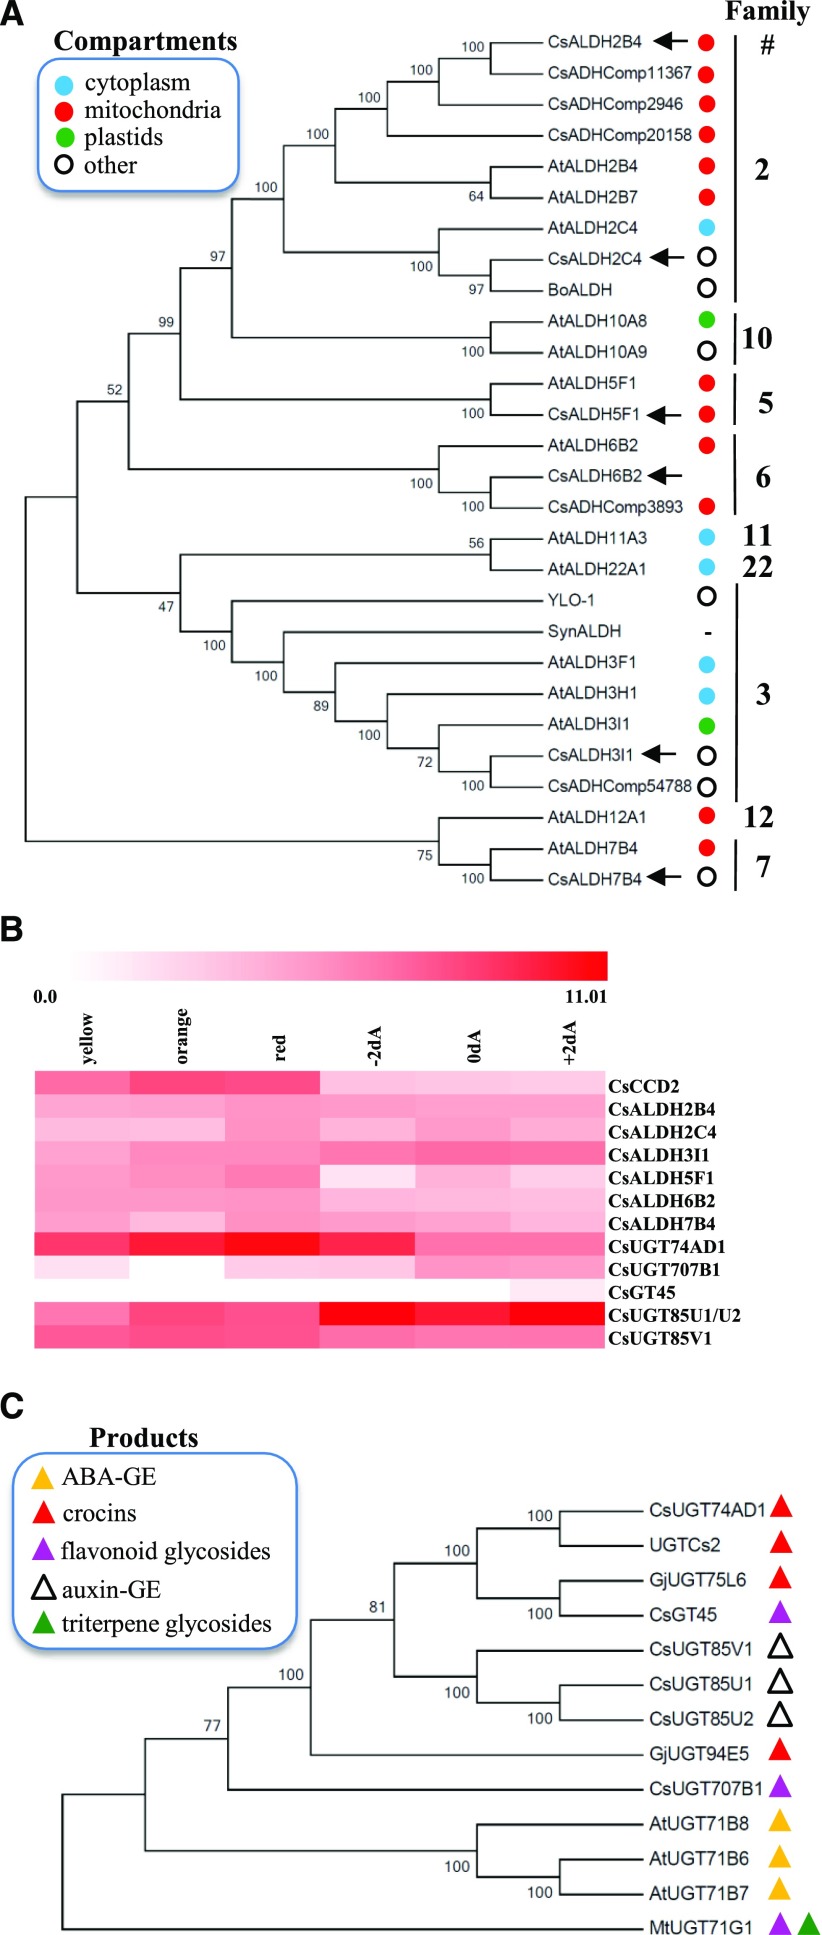
Figure 2.
Candidate genes for crocin biosynthesis in C. sativus stigmas. A, Phylogenetic relationships between ALDHs of C. sativus (Cs), Arabidopsis (At), B. orellana (Bo), Synechocystis spp. (Syn), and N. crassa (YLO-1), inferred using the neighbor-joining method. The subcellular localizations of ALDH enzymes, experimentally demonstrated by Stiti et al. (2011b) or predicted by TargetP, are indicated by colored dots. Accession numbers are as follows: CsALDH2B4 (MG672523), CsALDH2C4 (MF596160), CsALDH3I1 (MF596165), CsALDH5F1 (MF596161), CsALDH6B2 (MG672524), and CsALDH7B4 (MF596162; all described in this article, indicated by black arrows); AtALDHs (Stiti et al., 2011b); BoALDH (AJ548846; Bouvier et al., 2003a); SynALDH (ALJ68758.1; Trautmann et al., 2013); YLO-1 (XP_011394899.1; Estrada et al., 2008); and CsADHComp2946 (AQM36713.1), CsADHComp11367 (AQM36717.1), CsADHComp20158 (AQM36716.1), CsADHComp3893 (AQM36715.1), and CsADHComp54788 (AQM36714.1; Gómez-Gómez et al., 2017). B, Expression of C. sativus CCD2, ALDH, and UGT enzymes in stigma tissue at different developmental stages. Data are expressed as log2 of fragments per kilobase per million. Developmental stages are as follows: yellow, orange, red, 2 d before anthesis (−2dA), day of anthesis (0dA), and 2 d after anthesis (+2dA). C, Phylogenetic relationships between UGTs of C. sativus (Cs), Arabidopsis (At), G. jasminoides (Gj), and M. truncatula (Mt), inferred using the neighbor-joining method. Accession numbers are as follows: CsUGT74AD1 (MF596166; described in this article); UGTCs2 (AAP94878.1; Moraga et al., 2004); CsGT45 (ACM66950.1; Moraga et al., 2009); CsUGT85V1 (AIF76150.1), CsUGT85U1 (AIF76152.1), and CsUGT85U2 (AIF76151.1; Ahrazem et al., 2015; Gómez-Gómez et al., 2017); CsUGT707B1 (CCG85331.1; Trapero et al., 2012); AtUGT71B6 (NP_188815.1), AtUGT71B7 (NP_188816.1), and AtUGT71B8 (NP_188817.1; Dong and Hwang, 2014); GjUGT94E5 (F8WKW8.1) and GjUGT75L6 (F8WKW0.1; Nagatoshi et al., 2012); and MtUGT71G1 (AAW56092.1; Shao et al., 2005). The biosynthetic products of the various UGTs are represented by colored triangles. In A and C, the percentages of replicate trees that clustered together in the bootstrap test are indicated to the left of the branches.

