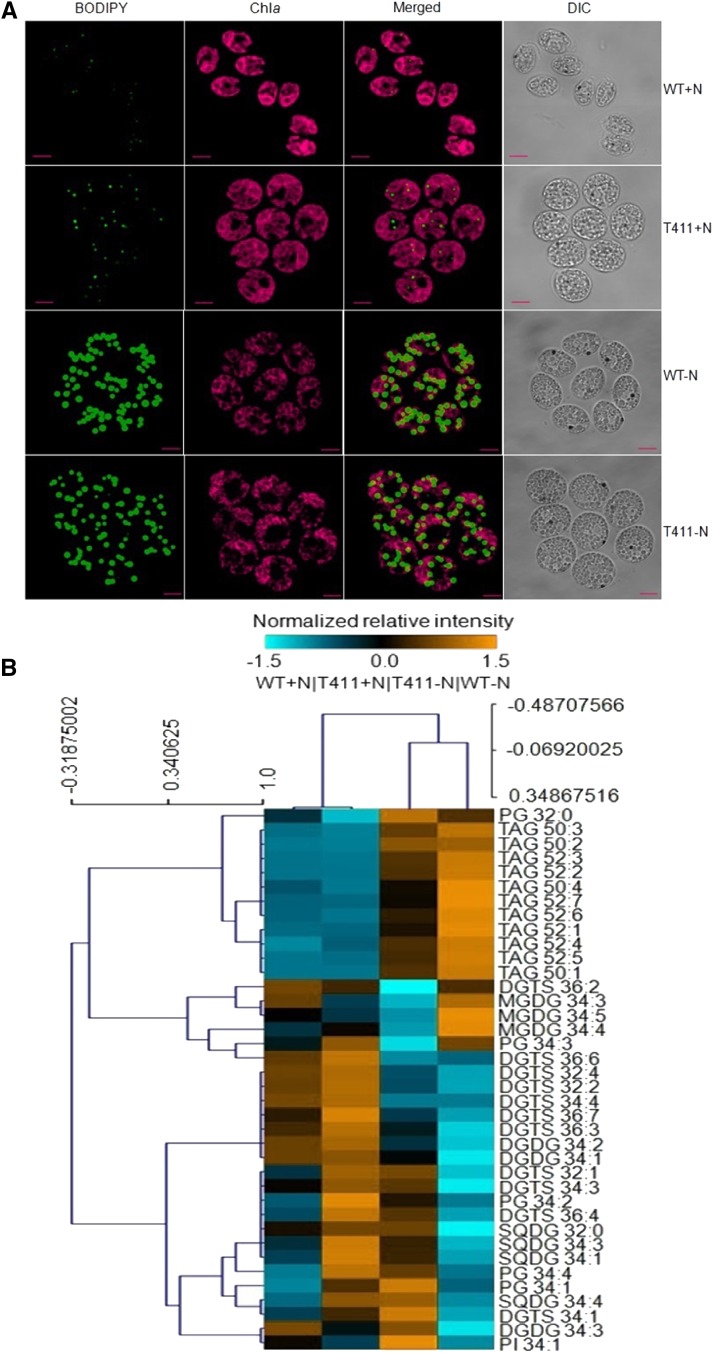
Figure 3.
Imaging and lipidomic profiling of wild type and T411 under +N and −N conditions. A, Confocal imaging confirmed there were larger and more circular mutant cells that exhibited mildly higher TAG fluorescence in both conditions than the wild type (WT). The scale bar indicates 5 μm. B, The total lipids isolated from the wild type and T411 under +N and −N were subjected to Nanomate LTQ-MS/MS analysis. A heat map of 38 lipid species, excluding four lyso-DGTS species, were detected. DGTS, diacylglyceryltrimethylhomo-Ser; MGDG, monogalactosyldiacylglycerol; DGDG, digalactosyldiacylglycerol; SQDG, sulfoquinovosyldiacylglycerol; PI, phosphatidylinositol; PG, phosphatidylglycerol; TAG, triacylglycerol. The elemental compositions and proposed molecular formula are described in Supplemental Table S1. The precise intensity ratio values are presented in Supplemental Table S2.

