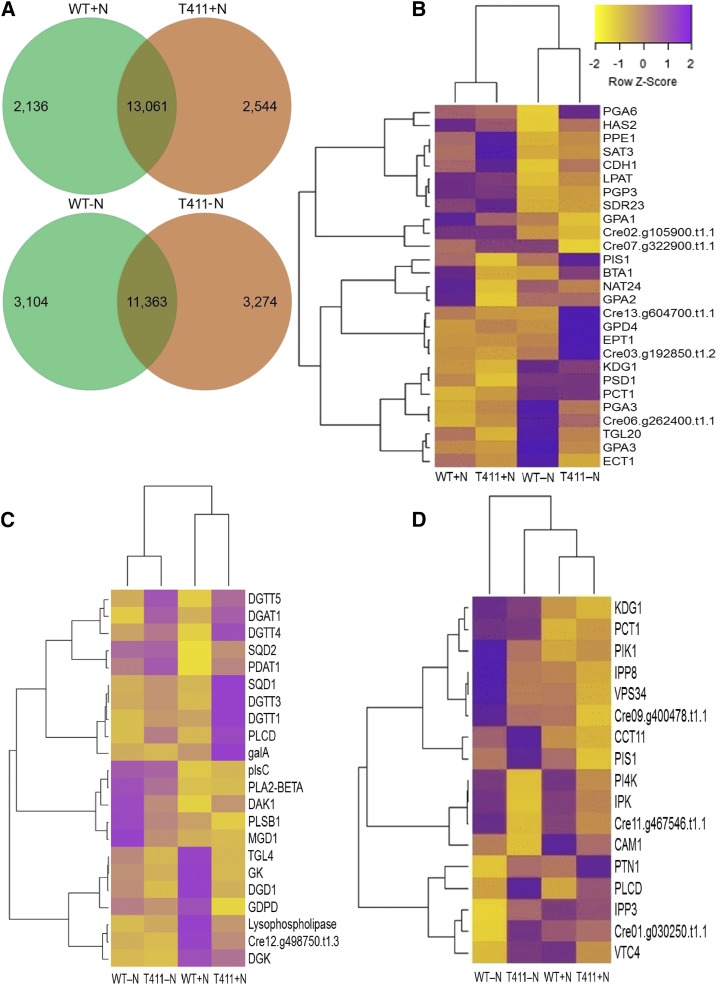
Figure 4.
RNA-seq analysis of lipid metabolism and signaling pathways under growth and starvation conditions. A, Venn diagram showing overlapping transcripts among the total transcripts with ≥2-fold change in expression obtained from the wild type (WT) and T411 mRNA under +N and −N conditions. Heat map and cluster analysis of the differential gene expression of genes involved in the glycerophospholipid pathway, B, glycerolipid pathway, C, and PI signaling pathway, D, in wild-type and T411 cells under +N and −N conditions. For detailed gene annotation, please refer to Supplemental Table S5.

