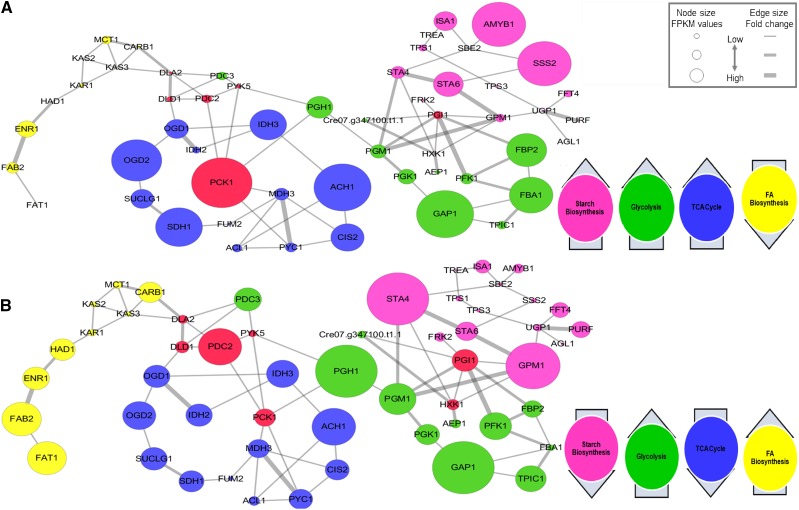
Figure 5.
Gene network analysis of four pathways involved in energy metabolism under stress in algae. A, Gene network of the wild type (WT) under –N conditions based on the FPKM values compared to the wild type under +N conditions. The gene network was constructed using relative mRNA levels and was visualized by Cytoscape v 3.2.1. The circular edges represent FPKM values, and each node represents the relative fold change between adjoining edges. B, Gene network of T411 under –N conditions based on the FPKM values compared to the wild type under +N condition. Green circles represent glycolysis pathway genes; blue represents TCA pathway genes; pink represents starch and Suc metabolism pathway gene; yellow represents FA biosynthesis pathway genes; and red represents genes influencing more than one pathway. For detailed gene annotation, please refer to Supplemental Table S5.

