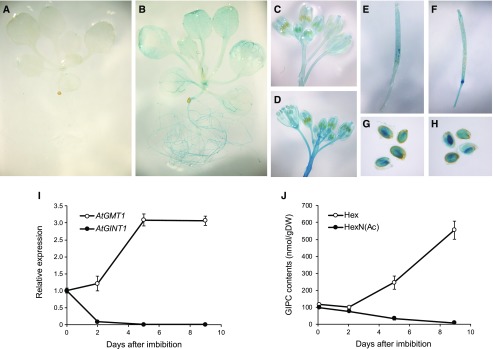
Figure 2.
Tissue-specific expression of AtGINT1 and AtGMT1 and comparison of GIPC subclasses. A to H, Promoter-GUS staining indicating expression patterns of AtGINT1 (A, C, E, and G) and AtGMT1 (B, D, F, and H) in young seedlings (A and B), flowers (C and D), developing siliques (E and F), and mature seeds (G and H). I and J, GT expression analysis (I) and quantification of GIPC contents (J) during seed germination. Data are means of three or four biological replicates ± sd.

