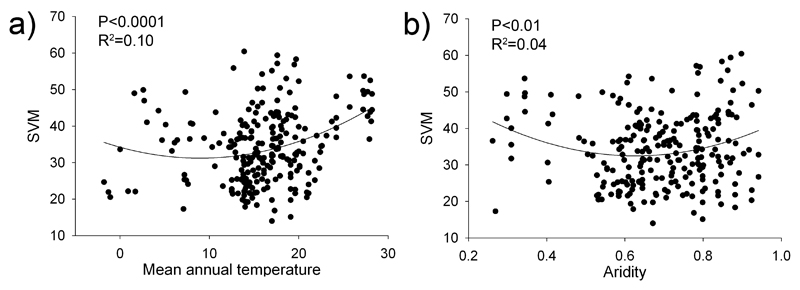
Figure 1.
Relationships between mean annual temperature and aridity [defined as 1-aridity index (ratio of precipitation to potential evapotranspiration)] and the variability (coefficient of variation) of soil multifunctionality (SVM). The solid lines represent the fitted regressions. R2 shows the proportion of variance explained.

